Pulse24 Original
Gold Climbed Back Above $4,600 an Ounce, Matching UBS's Year-End Target Four Months Ahead of Schedule. Silver, Priced Near $68.90, Is Still Below Where It Stood the Day After February's Crash.
August 22, 2026
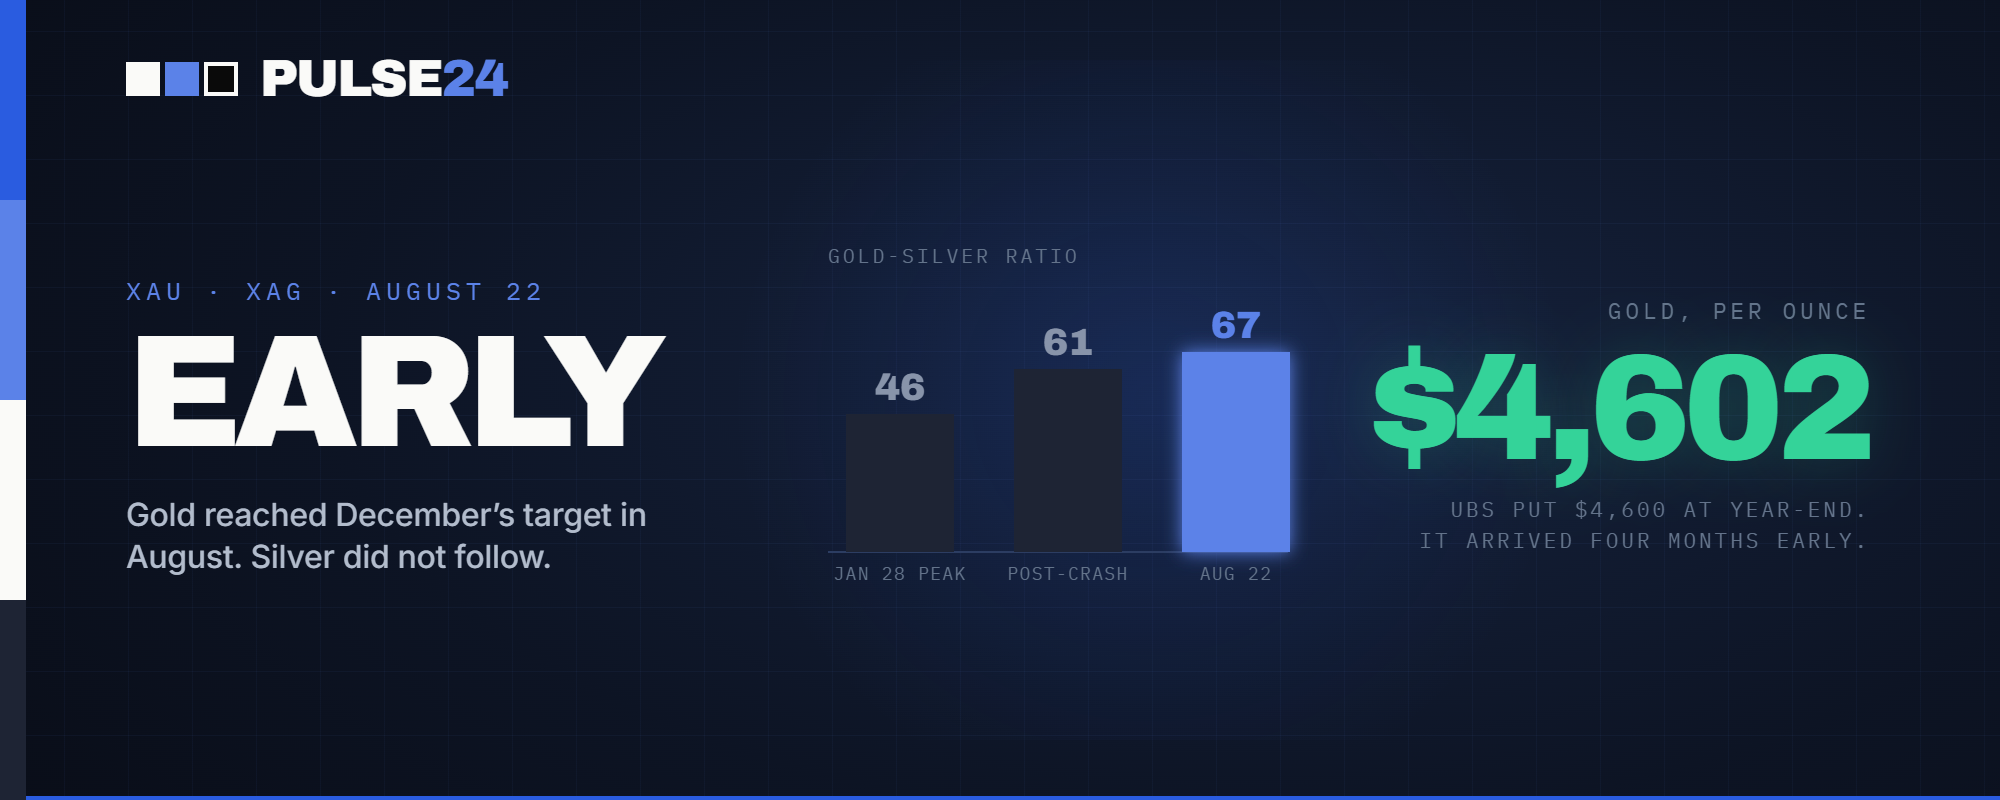
Gold's recovery from January's record-high blowoff has it trading almost exactly where UBS told clients to expect it by December, four months early. Silver hasn't managed the same comeback, and the widening gap between the two metals says something about who's actually driving this rally.
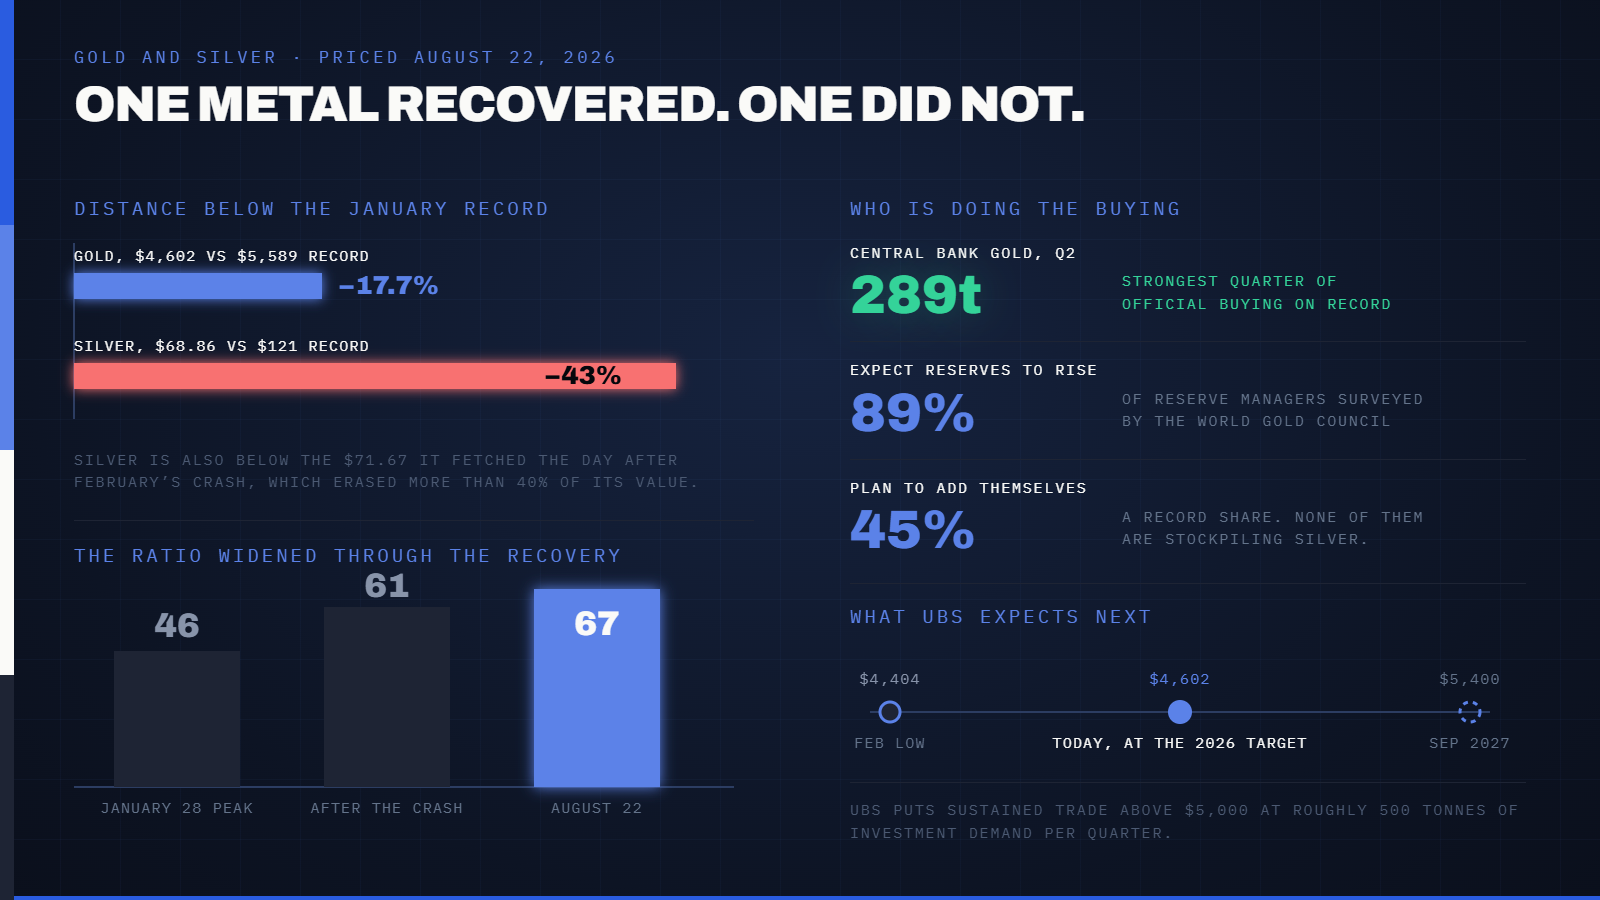
Gold traded near $4,602 an ounce Friday morning, up better than 1.8% on the day and sitting almost exactly where UBS told clients to expect it by the end of December. The bank just didn't think it would get there until winter. Silver, priced near $68.86 the same morning, tells a less flattering story. It's actually below where it stood the day after a crash that erased more than 40% of its value in February.
What Changed
Gold set an all-time high of $5,589.38 an ounce on Thursday, January 28. Two days later, President Trump nominated Kevin Warsh, a former Fed governor known for a hawkish reputation on inflation, to succeed Jerome Powell as chair. The dollar, which had been sitting near four-year lows, snapped higher within hours as traders repriced the path of future rate policy. By the following Monday, gold had fallen 21.2% to $4,404 an ounce. Silver fell even harder, down 41.1% from its own record above $121 to $71.67. A veteran of the ICBC precious metals desk called the two-day move "unprecedented" after four decades in the market.
Warsh's path to the chair took months longer than the initial market reaction suggested it would. The Senate confirmed him 54-45 on May 13, and he took the oath of office on May 22. Gold didn't move in a straight line while that played out. It clawed back above $5,300 by early March, then gave back 12% that same month, its worst month since 2008, as fears of a broader Middle East war pushed oil above $100 a barrel and complicated the inflation outlook. By mid-April it had rebuilt to near $4,800, then eased lower again over the summer. Pulse24 tracked it near $4,419 in mid-August as softening inflation data pulled Fed rate-hold odds higher, then watched it jump past $4,550 after the Treasury doubled its long-bond buybacks to cool a spike in 30-year yields. By last week, with the dollar sliding to a three-month low and the national debt crossing $40 trillion, gold had cleared $4,600. Friday's price keeps it there.
Why It Matters
UBS's own forecasting shows how far ahead of schedule this recovery has run. As of mid-August, the bank's near-term target for gold was $4,600 an ounce by the end of 2026. Gold hit that number in August, not December. UBS's strategists now point further out, to $5,400 by the end of September 2027, arguing that a less restrictive Fed policy stance and a broadly weaker dollar should keep pulling money toward an asset that pays no yield. They've also flagged a threshold worth remembering: roughly 500 metric tons of investment demand per quarter is what the bank thinks gold needs to trade sustainably above $5,000. Getting back to that level will take more than central banks buying on their own.
That's where silver's lag becomes the more interesting half of this story. Silver typically outperforms gold when precious metals are rallying broadly, because industrial and retail buying give it a higher beta in both directions. Instead, the gold-silver ratio, which measures how many ounces of silver it takes to buy one ounce of gold, has climbed from about 46 at January's blowoff top to roughly 61 right after the crash to nearly 67 today. A rising ratio during a recovery usually points to a narrower kind of buyer, one motivated by currency debasement and reserve diversification rather than a broad-based commodity trade. Central banks bought a net 289 tonnes of gold in the second quarter, the strongest three months of official buying on record, and the World Gold Council's survey found 89% of reserve managers expect that trend to continue. None of those institutions are stockpiling silver bars.
What to Watch Next
The Kansas City Fed's Jackson Hole symposium runs August 27 through 29 in Wyoming, and Warsh gives his first keynote as chair on the final day, just weeks after the man whose nomination once cratered these same two metals. He's signaled the speech will address the "big picture" rather than get pinned down by short-term market pricing, which leaves room for him to say something that moves gold, the dollar, or both heading into the September 16 FOMC meeting. September rate-hike odds have already faded from above 80% in late July to roughly 30% since a soft July jobs report, so Warsh has some room to sound less hawkish than his reputation suggested in January without surprising anyone.
Silver's ratio to gold is worth tracking on its own terms in the weeks ahead. A ratio that starts falling back toward the low 60s would suggest broader buying is returning to the metals trade beyond central bank reserve managers. A ratio that keeps climbing would say the opposite, that this remains a narrow, debt-and-dollar-driven rally rather than the kind of across-the-board precious metals run that tends to mark a later stage of the cycle.
The Pulse24 Take
It's worth sitting with the irony here. The same nomination that triggered a two-day, 21% crash in gold back in January has, seven months later, put a Fed chair on stage at Jackson Hole with gold trading almost exactly where a major bank predicted it would land by year's end. Markets rarely close a loop that neatly, and the fact that they have doesn't mean the next leg is guaranteed to be smooth.
Silver's underperformance is the part of this story that deserves more attention than it's getting. A gold rally led by central bank reserve managers and debt anxiety is a different animal than one led by broad investor demand across every precious metal, and the ratio between the two is one of the more honest gauges of which kind of rally is actually underway. Right now it's telling a fairly narrow story. Whether that changes probably depends less on what happens to the debt or the dollar and more on whether the buyer base for this rally ever widens beyond the institutions that have been doing most of the buying since spring.
How we read the data
Curious how we get from raw data to a take like this? Our Trader's Toolkit walks through the tools we lean on.
Explore the Toolkit