Pulse24 Original
Gold Hit $4,419 an Ounce This Week on Cooling Inflation Data. Bitcoin Fell to $62,700 on the Exact Same Numbers.
August 14, 2026
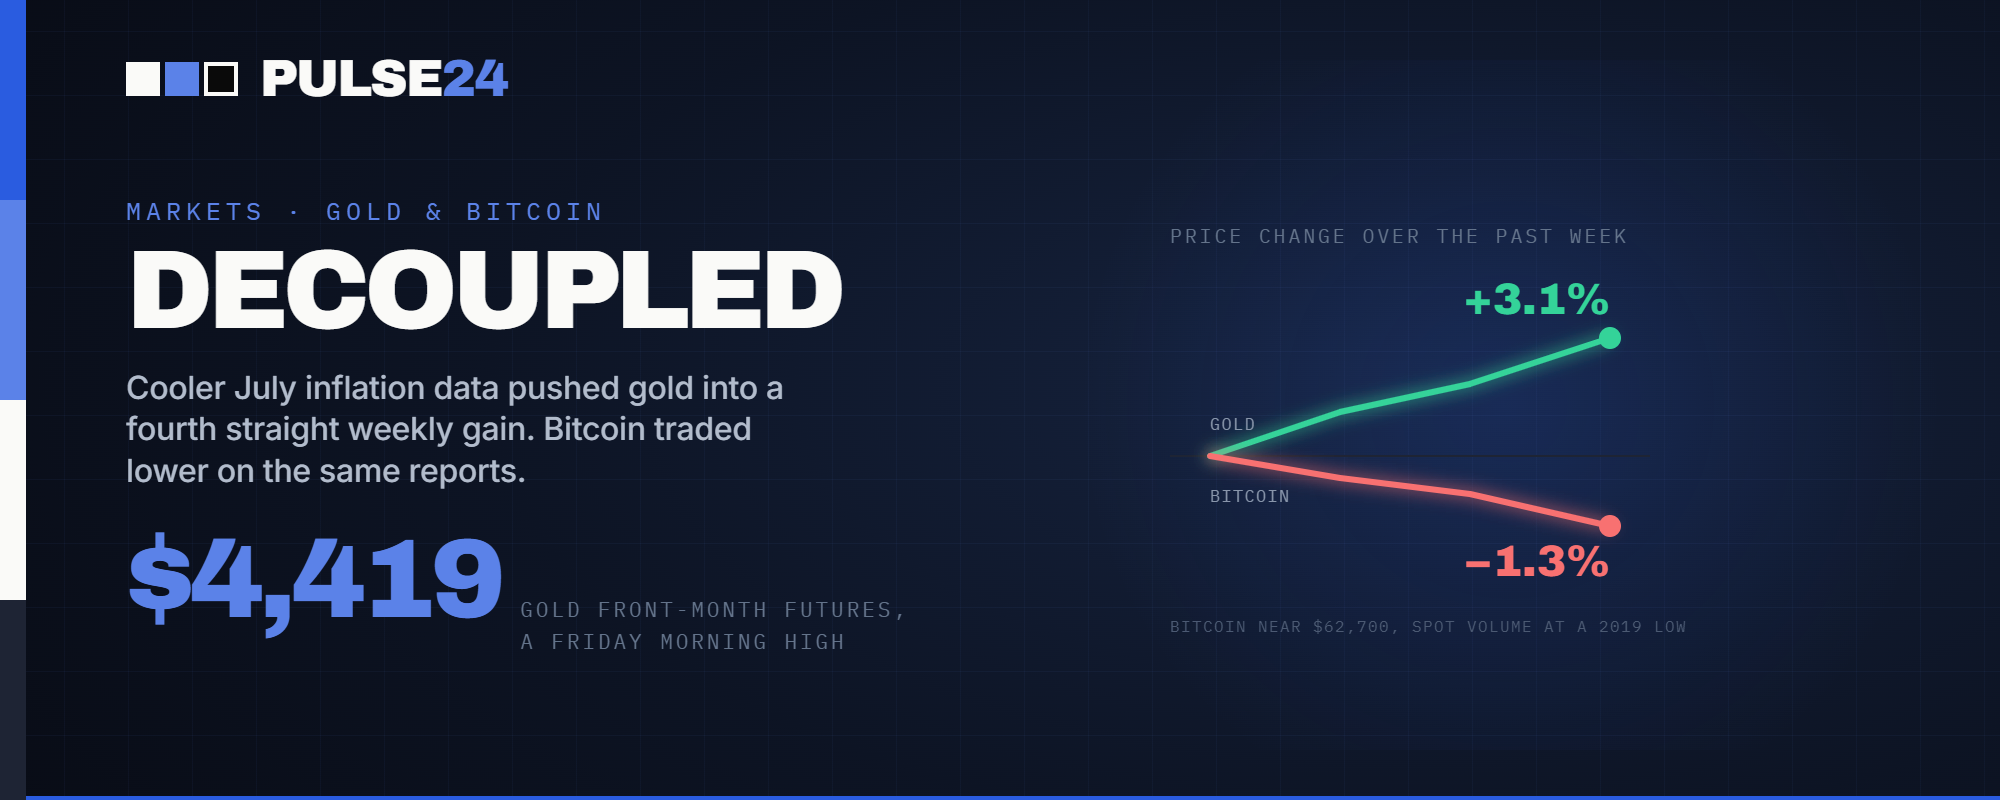
Gold climbed to $4,419 an ounce this week as traders priced in higher odds the Fed holds rates steady in September. Bitcoin fell on the same inflation data, dragged down by ETF outflows and the thinnest spot trading volume since 2019.
Gold's front-month futures touched $4,419.60 an ounce Friday morning, part of a run that has added more than 3% to the metal's price this week alone. A few blocks away in market-structure terms, Bitcoin sat near $62,700, down for the same stretch. Both moves trace back to the same batch of July inflation data. Only one of them looks like the textbook reaction to it.
What Changed
July's producer price index rose 4.7% year over year, down from 5.5% in June and below the 4.9% economists had forecast. Pulse24 covered the report and the number hiding inside it earlier this week. Consumer prices told a similar story: July CPI landed at 3.4%, matching every forecast on the Street and confirming the softer trend PPI had already flagged.
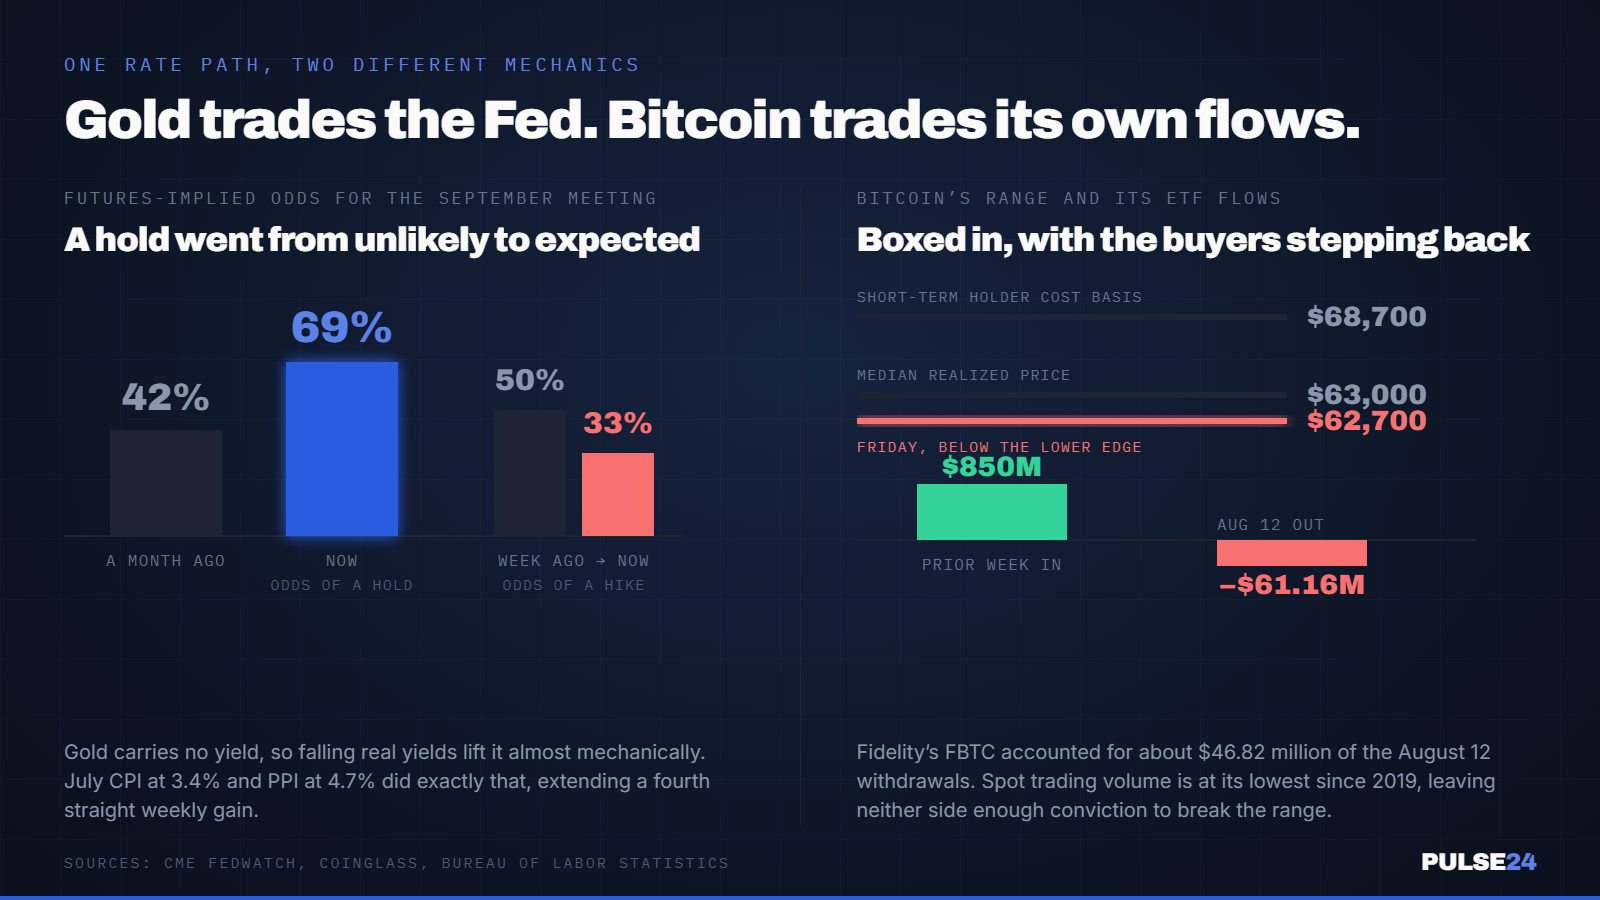
Together, the two reports did what soft inflation data is supposed to do. They pulled forward the timeline for the Fed to stop worrying about another rate increase. September hike odds slid to roughly 33%, down from near 50% a week earlier, based on CME futures pricing. The probability the Fed simply holds rates steady in September climbed to about 69%, up from 42% a month ago.
Gold answered on cue. The metal already broke out to a two-month high on August 10 as the same trade started building, and this week's move extends that run into a fourth straight week of gains. Bitcoin did not answer. It traded near $62,700 Friday morning, down about 1.3% for the week. Ether held up a little better, up 6.3% for the month, though it was still down 0.9% over the past seven days.
Why It Matters
US spot Bitcoin ETFs shed $61.16 million on August 12 alone, according to CoinGlass data, with Fidelity's FBTC responsible for roughly $46.82 million of the withdrawals. That single day erased most of the goodwill built up the week before, when the same funds pulled in close to $850 million. Bitcoin ETF flows have swung this hard before this summer. Four straight days of inflows totaled $626 million less than two weeks ago, and even the CLARITY Act stalling in the Senate didn't stop $853 million from coming in the following week. What's different now is that the swings are landing with no clear catalyst attached to them, which is itself part of the signal.
Underneath the flow data, spot trading volume has fallen to levels not seen since 2019. Buyer participation has stayed weak even as selling pressure has eased, which leaves the market without enough conviction on either side to break out of its range. That range has real edges. Bitcoin's median realized price sits near $63,000, and the short-term holder cost basis sits near $68,700. The coin has rejected multiple attempts to clear that upper band, and Friday's price puts it close to testing the lower one instead.
The deeper reason for the split comes down to how each asset actually responds to the Fed. Gold carries no yield, so it becomes mechanically more attractive whenever real yields fall, and this week's inflation data did exactly that. Bitcoin doesn't have that direct a channel. Its price leans more on positioning, leverage and the pace of ETF demand than on the rate path itself, and none of those three have been cooperating lately. A Fed that hikes less isn't automatically bullish for an asset whose biggest recent buyers just walked away for a day.
What to Watch Next
August's inflation data lands in the weeks before the September Fed meeting and will matter more than usual, since both July reports were already close to consensus and didn't leave the market much to reprice. A hotter August CPI or PPI print could put the hike odds back in play and pressure both assets at once. A soft one probably keeps gold's rally intact without doing much for Bitcoin on its own.
For Bitcoin specifically, the levels to watch are the $63,000 support and $68,700 resistance that have bounded the past several weeks of trading. A daily close below $63,000 would open the door to testing the low $60,000s, while a sustained push through $68,700 on rising spot volume, not just ETF flows, would be the clearest sign the range is finally breaking. The Fear and Greed Index sitting at 29 suggests positioning is already cautious enough that either move could happen fast.
The Pulse24 Take
Gold and Bitcoin get grouped together often enough that traders sometimes forget they respond to different mechanics. Gold's relationship to real yields is close to mechanical. When the market prices in a friendlier Fed, gold tends to move first and cleanly. Bitcoin's relationship to Fed policy runs through a noisier channel of leverage, ETF demand and spot conviction, and right now two of those three are missing.
This isn't the first time the pairing has broken down. Bitcoin and gold moved almost in lockstep during the liquidity-driven rallies of 2020 and 2021, which is probably why the two still get compared as a matched set. But that correlation was arguably the unusual case, built on a flood of stimulus that lifted every asset with a scarcity story at once. What's happening now, gold tracking the rate path while Bitcoin gets stuck on its own supply-demand mechanics, looks closer to how the two assets behaved for most of the decade before that. If August's inflation data comes in soft again, watch whether Bitcoin's ETF flows turn consistently positive before assuming the old correlation is coming back. Right now, the money says it hasn't.
How we read the data
Curious how we get from raw data to a take like this? Our Trader's Toolkit walks through the tools we lean on.
Explore the Toolkit