Pulse24 Original
The S&P 500 Broke 7,800 for the First Time Thursday. The Producer Price Report That Helped Send It There Hid a Number the Fed Can't Ignore.
August 13, 2026
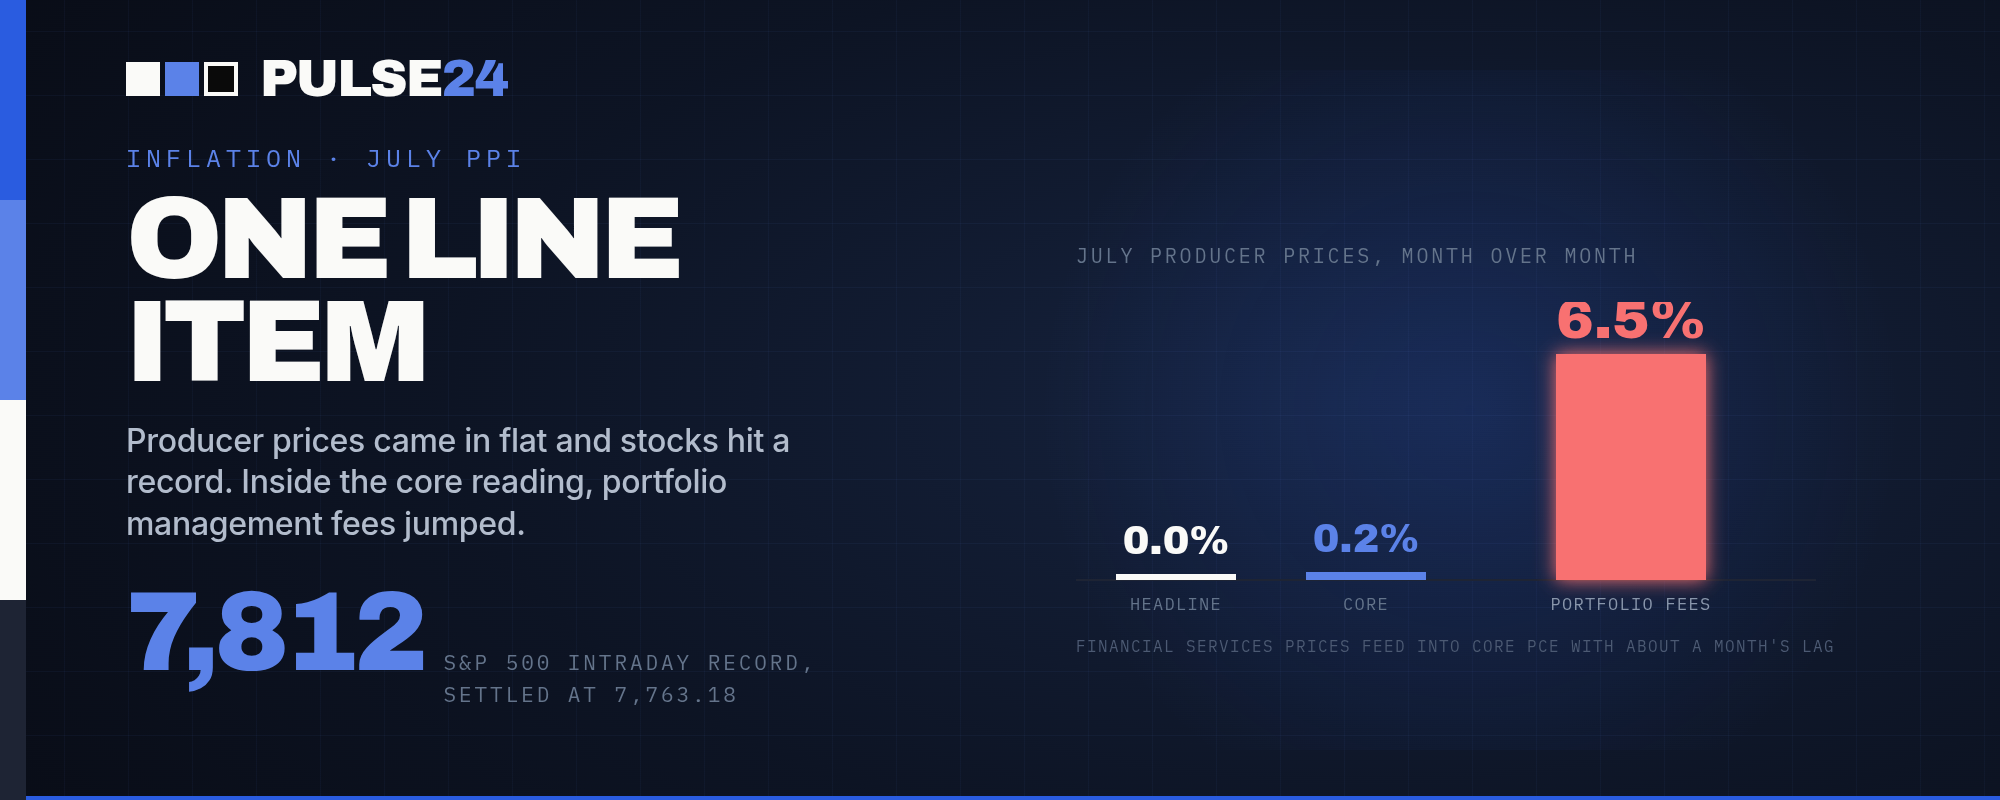
The S&P 500 broke above 7,800 for the first time Thursday after July's producer price report came in flat, with core prices also undershooting forecasts. But a 6.5% jump in portfolio management fees, a category that feeds mechanically into the Fed's preferred PCE gauge, complicates the read ahead of the August 26 release.
The S&P 500 crossed 7,800 for the first time on Thursday, a level the index has never traded above, and it did so on the same morning the government released an inflation report that looked almost sleepy at first glance. Headline producer prices did not move at all in July. Wall Street had penciled in a 0.2% increase.
A flat print after a run of hot ones is normally the kind of news that sends stocks higher without much debate, and for a few hours it did exactly that. The index touched an intraday record near 7,812 before easing back to close at 7,763.18, the Dow finished near 53,933, and the Nasdaq added about 0.6%. Small caps did even better: the Russell 2000 set its 27th record close of the year. None of that is in question. What is worth a closer look is what was sitting underneath the number that got markets there.
What Changed
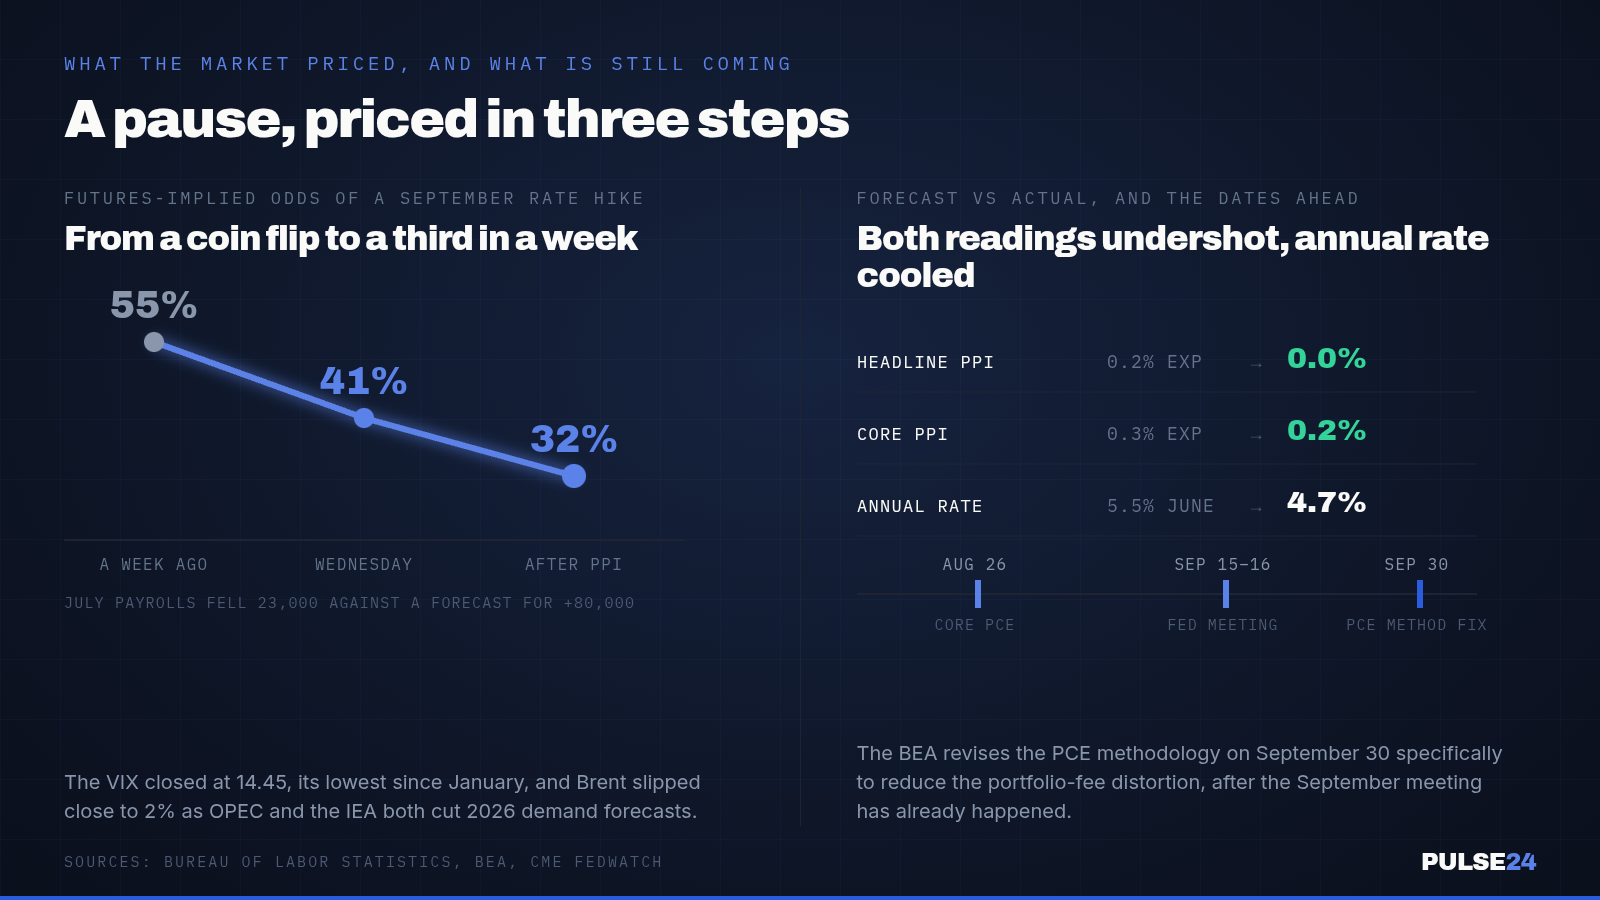
Strip out food, energy and trade services, and core producer prices rose 0.2% in July, a touch below the 0.3% consensus estimate. On its face, that is a second straight month of cooler-than-feared inflation data, following a July CPI report that matched every forecast on the Street two days earlier. But one line item inside the core PPI report deserves more attention than the headline number got. Portfolio management fees, the prices firms charge to manage other people's money, jumped 6.5% in July. That sounds like a narrow, almost bureaucratic detail, except that it is not cosmetic. Financial services prices from PPI flow directly into core PCE, the inflation gauge the Fed actually targets rather than the CPI number that makes headlines, and a spike in portfolio fees tends to show up there with a lag of about a month. The Bureau of Economic Analysis has already said it plans to revise the PCE methodology on September 30 specifically to strip out this kind of mechanical feedback loop, which is itself a sign regulators think the current setup overstates the signal.
This is the same data set Pulse24 flagged after July's CPI report two days ago, when headline inflation matched every forecast on the Street and markets shrugged because a weak jobs report had already done the work of pricing in a Fed pause. July payrolls fell by 23,000 against a forecast for an 80,000 gain, and that miss alone cut the odds of a September hike roughly in half within hours. Thursday's PPI report continued that slide. CME futures-implied odds of a hike next month sat near 55% a week ago, eased to about 41% by Wednesday, and fell further to roughly 32% once the PPI numbers landed Thursday.
Oil added its own piece to the story. Brent crude gave back close to 2% Thursday, part of a broader retreat after OPEC and the International Energy Agency both trimmed their 2026 demand outlooks and a US inventory report showed crude stockpiles jumped by more than 17 million barrels in a single week, among the largest weekly builds in years. Lower energy costs feed into headline inflation with a lag, and traders treated the pullback as one more reason the Fed's job just got a little easier, at least on paper.
Why It Matters
Two things are true about Thursday's rally at once, and they pull in different directions. The market's move to a record is a genuine reflection of an economy where corporate earnings, especially anything touching AI infrastructure, have kept beating expectations even as growth slows elsewhere. That is a real and defensible reason for stocks to be higher than they were in late January, when the index first crossed 7,000.
The other truth is that the index is trading near 27 times earnings, above the historical average in the high teens to low twenties, and the S&P's total market value is already sitting close to $70.8 trillion. Berkshire Hathaway's own favorite valuation gauge, the ratio of total market value to GDP, was already flashing dot-com-era readings before Thursday's move pushed it higher still. None of that means a correction is imminent. Expensive markets can stay expensive for a long time, particularly when earnings keep growing into the multiple rather than away from it. But it does mean the market has less room for error than a flat inflation headline alone would suggest.
The core PPI detail is the part investors chasing the record high risk missing entirely. A soft 0.2% core reading is genuinely good news for the disinflation story, but it is not a clean read. When a big chunk of a report's internal composition comes from an idiosyncratic category like portfolio fees, which tend to rise mechanically when asset prices rise, the report ends up partly measuring the market's own rally rather than underlying price pressure in the economy. That is exactly the kind of feedback loop the BEA's planned methodology change is meant to address, and it is a reason to treat any single month's core print, hot or cool, with some caution until that fix lands.
What to Watch Next
The next real test is the August 26 core PCE release, the report the Fed weighs most heavily and the one most directly affected by today's portfolio-fee spike, at least until the September 30 methodology revision takes effect. The 10-year Treasury yield's round trip back above 4.7% earlier this week already showed how quickly rate-hike odds can swing on a single data point, and PCE carries more weight with the committee than either CPI or PPI on their own.
Gasoline is the other line worth tracking. National average pump prices have ticked back above $4 a gallon in recent weeks even as wholesale oil eased Thursday, which means August's inflation data could look tougher than July's regardless of what happens with core services. The Fed's September 15-16 meeting is still five weeks out, long enough for two more jobs reports and another full inflation cycle to reshape the odds again before anyone on the committee has to vote.
The Pulse24 Take
Markets are treating Thursday as an unambiguous green light, and on the surface, they have reason to. Stocks at a record, inflation odds falling, oil and volatility both easing at once. Layer in the composition of the PPI report and the picture gets more textured rather than more alarming. A soft core reading that owes an outsized share of its movement to one financial-services line item is not the same signal as broad-based disinflation across goods and services, and it would be a mistake to treat one month of noisy, soon-to-be-revised data as definitive proof of either story.
What Thursday's session actually confirms is that the market's two biggest swing factors right now, AI-driven earnings growth and the Fed's rate path, are pulling from the same well of data and occasionally point in opposite directions. Investors who bought the record high because inflation looked tame got the number they wanted. Whether that number holds up once August 26 rolls around, and once the PCE methodology itself changes in September, is a separate question entirely, and it is the one that will actually decide where the S&P trades from here.
How we read the data
Curious how we get from raw data to a take like this? Our Trader's Toolkit walks through the tools we lean on.
Explore the Toolkit