Pulse24 Original
Berkshire Hathaway Ended a 14-Quarter Selling Streak in Q2. Its Own Favorite Valuation Gauge Says Stocks Haven't Been This Expensive Since the Dot-Com Bubble.
August 9, 2026
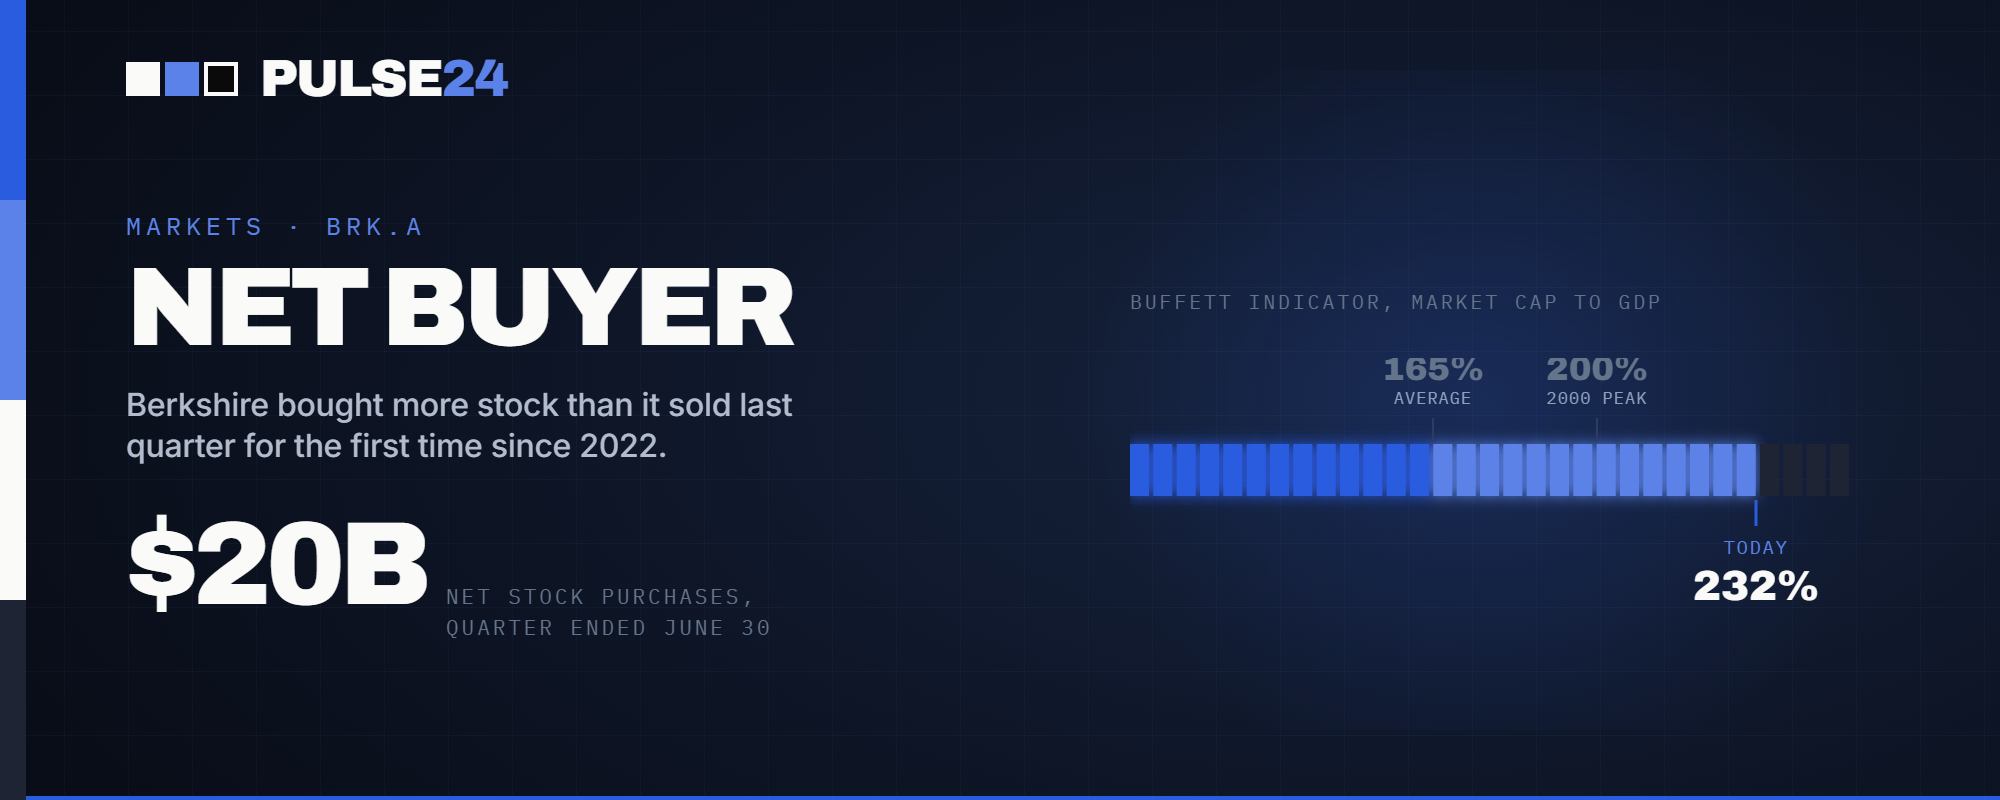
Berkshire Hathaway bought almost $20 billion more stock than it sold last quarter, its first net buying quarter since 2022. It happened as the market it bought into sits at valuations last seen at the peak of the dot-com bubble.
Berkshire Hathaway spent more on stocks than it sold last quarter for the first time since the third quarter of 2022. The company disclosed close to $20 billion in net purchases for the three months ended June 30, snapping a streak of 14 consecutive quarters as a net seller, a stretch that ran through most of the market's steepest AI-driven rally in years.
The timing is what makes it interesting. Warren Buffett spent the better part of four years explaining, patiently and repeatedly, why his company kept piling up cash instead of buying stocks. At Berkshire's annual meeting in May, he compared the market to "a church with a casino attached," adding that the casino section had gotten more crowded than he'd ever seen it. Greg Abel, who became chief executive on January 1 with Buffett staying on as chairman, spent the second quarter putting money into that same casino.
What Changed
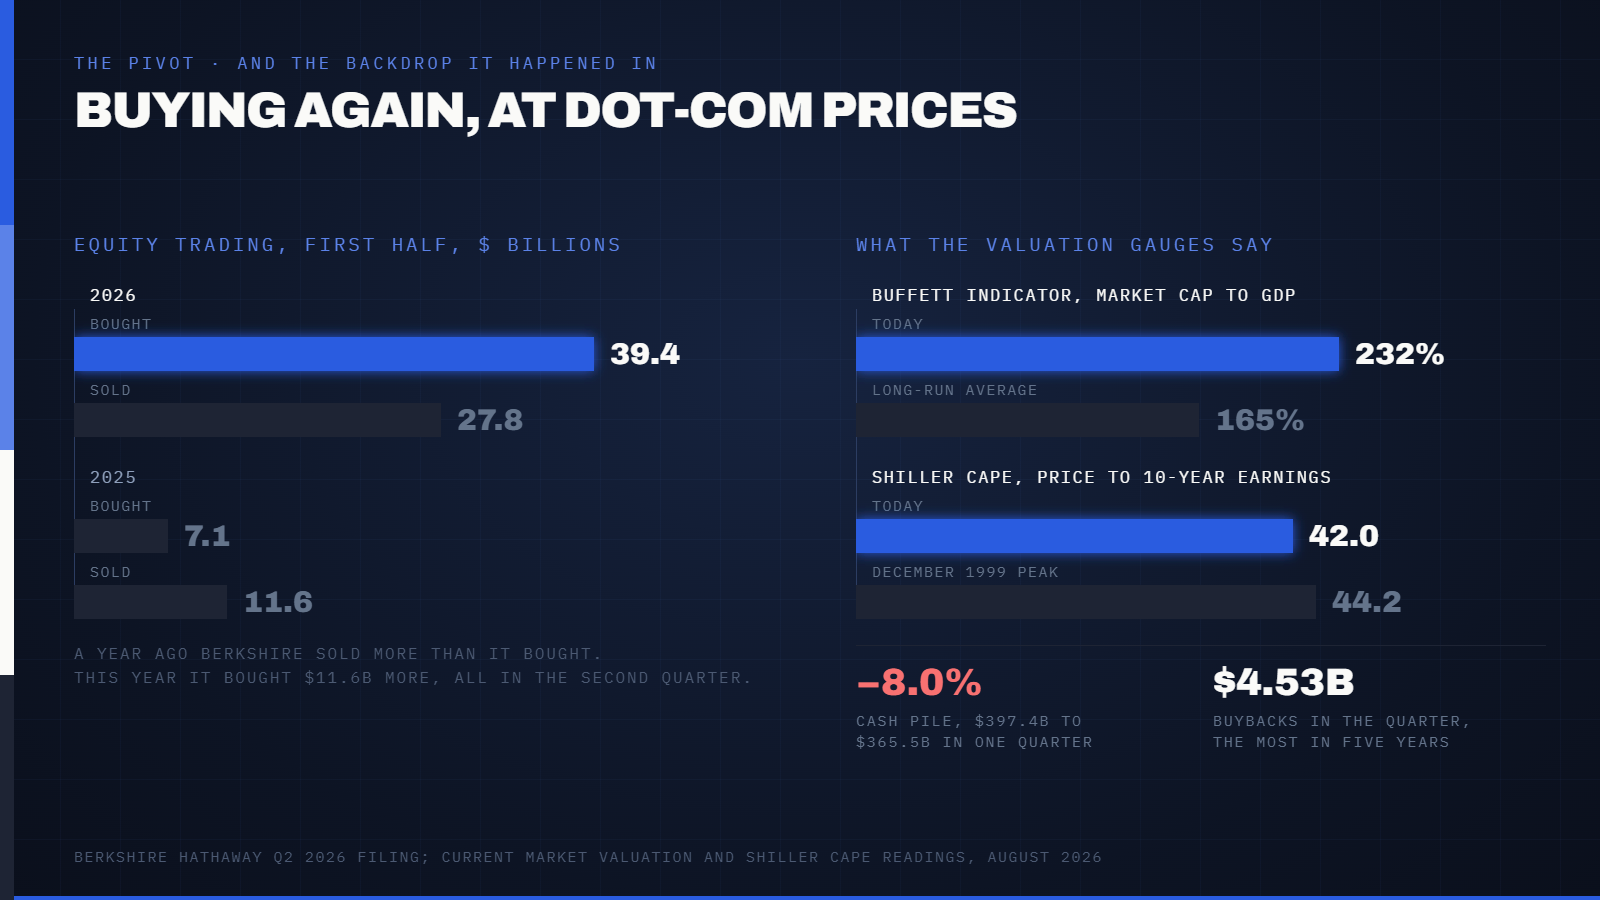
The numbers tell two stories that don't obviously agree. Berkshire's cash and short-term Treasury bills peaked at $397.4 billion at the end of the first quarter, the largest reserve in the company's history, generating roughly $12 billion a year in interest income on its own. By the end of the second quarter, that pile had shrunk to $365.5 billion. Berkshire bought $39.4 billion of stock and sold $27.78 billion in the first half of 2026 combined, versus just $7.09 billion bought and $11.59 billion sold over the same stretch in 2025.
Alphabet accounts for a large share of the shift. Berkshire more than tripled its position in the first quarter and then committed $10 billion to a private placement tied to the company's capital raise, a bet that leans directly into the AI infrastructure buildout that's on pace to reach roughly 3% of GDP by 2027. Abel also closed an $8.5 billion acquisition of homebuilder Taylor Morrison and pushed buybacks to $4.53 billion for the quarter, the highest in five years. None of it looks like a company bracing for a crash. It looks like a company that found a handful of prices it liked.
Why It Matters
The tension is worth naming directly. Berkshire started buying again in the same quarter that its own favorite valuation yardstick pushed to one of the highest readings on record. The Buffett Indicator, total U.S. market capitalization divided by GDP, is sitting above 230% by most measures, some as high as 238%, compared with a long-run average closer to 165%. That's well above where the indicator peaked near the dot-com top in 2000, and above where it first crossed 200% during the 2021 bull run. The Shiller CAPE ratio, a separate measure of stock prices against ten-year average earnings, is running close to 42, within shouting distance of the 44.2 reading it hit in December 1999, right before the dot-com bubble unwound.
None of that means a crash is imminent. High valuations have historically been better at predicting weak returns over the next decade than they have at timing when a selloff starts. The market traded above fair value for years before 2000 finally arrived, and investors who sold early missed some of the best gains of the cycle. What the valuation data does say, reasonably reliably, is that the price paid today matters more than usual for what an investor earns tomorrow. Berkshire buying into that backdrop is less a contradiction than a reminder that even expensive markets occasionally throw off individual prices worth paying, especially for a company sitting on $365 billion that needs to earn a return somewhere.
The Fed is part of this picture too. An equity rally that has pushed valuations to these levels has run alongside a rate story of its own. July's payrolls report showed the economy lost 23,000 jobs against a forecast for an 80,000 gain, and futures markets cut the odds of a September hike almost in half within hours. Cheaper future financing and record valuations don't usually coexist for long. Something in that pairing tends to give.
What to Watch Next
Berkshire reports its third-quarter activity in November, and that filing will show whether the pivot to buying was a one-time move into a handful of specific opportunities or the start of a longer pattern under Abel's leadership. Watch the cash balance first. A number that keeps drifting down toward $300 billion would suggest conviction. A rebound back toward $400 billion would suggest the buying was opportunistic and temporary.
Also worth tracking is where the Buffett Indicator goes from here. Readings this elevated have historically coincided with weak ten-year forward returns, not necessarily with sharp near-term drops. The Fed's September 16 decision and the steady drumbeat of AI capital spending headlines will likely move markets more in the next few weeks than the valuation debate itself, but the valuation math is the backdrop against which all of it gets priced.
The Pulse24 Take
The headline version of this story writes itself: Buffett's company is buying even as Buffett's own gauge says stocks are historically expensive. The more useful version is narrower. Berkshire didn't declare the market cheap. It found specific businesses, an AI-adjacent Alphabet bet chief among them, worth owning at a specific price, while leaving $365 billion on the sideline for whatever comes next. Valuation extremes tend to be slow-moving signals about long-run returns rather than short-term timing tools, and being early is not the same thing as being wrong. Berkshire ended a 14-quarter selling streak and still kept enough cash on hand to buy considerably more if prices come down. Being ready to act in either direction, rather than betting on a single outcome, is the position the company has actually taken.
How we read the data
Curious how we get from raw data to a take like this? Our Trader's Toolkit walks through the tools we lean on.
Explore the Toolkit