Pulse24 Original
JPMorgan Signed a $20 Billion Deal With Qatar Tuesday. Its Stock Still Fell 3%.
September 22, 2026
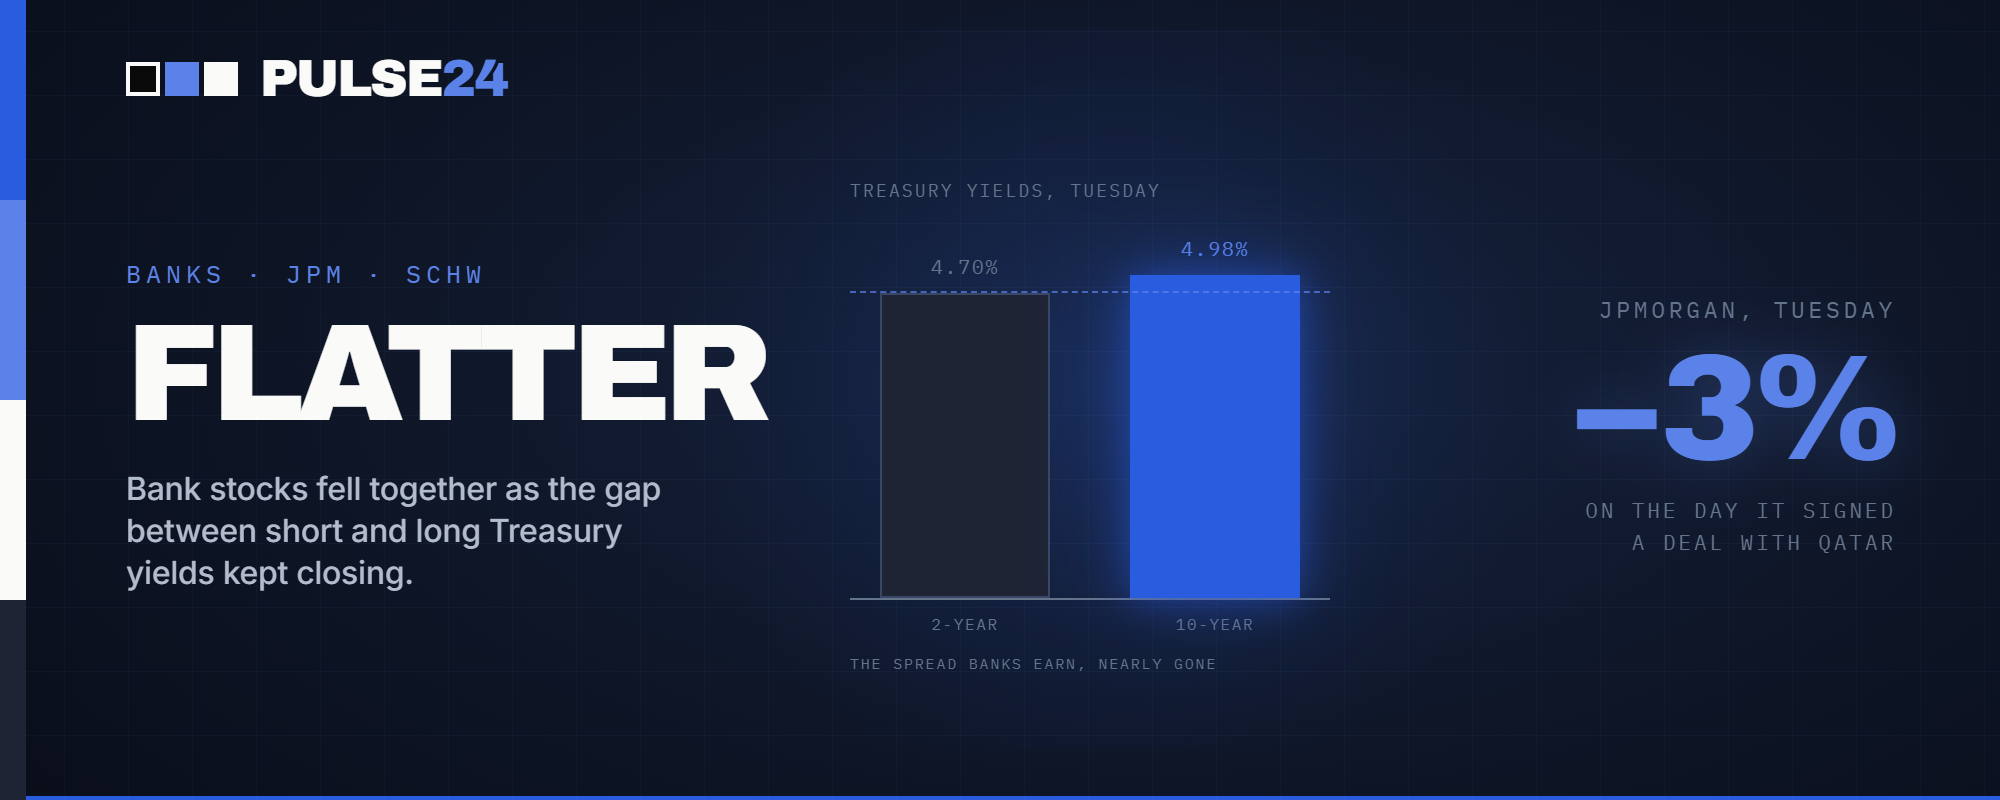
JPMorgan struck a $20 billion deal with Qatar's sovereign wealth fund on Tuesday, and its stock fell anyway. The real story was in the bond market, where a flattening yield curve is starting to squeeze the spread every bank and brokerage lives on.
JPMorgan Chase announced a $20 billion investment partnership with the Qatar Investment Authority on Tuesday morning, spanning a public equities mandate and a new private markets program financing US middle market companies in industrials, healthcare, services, and technology. The bank's stock fell 3% anyway, closing near $340.
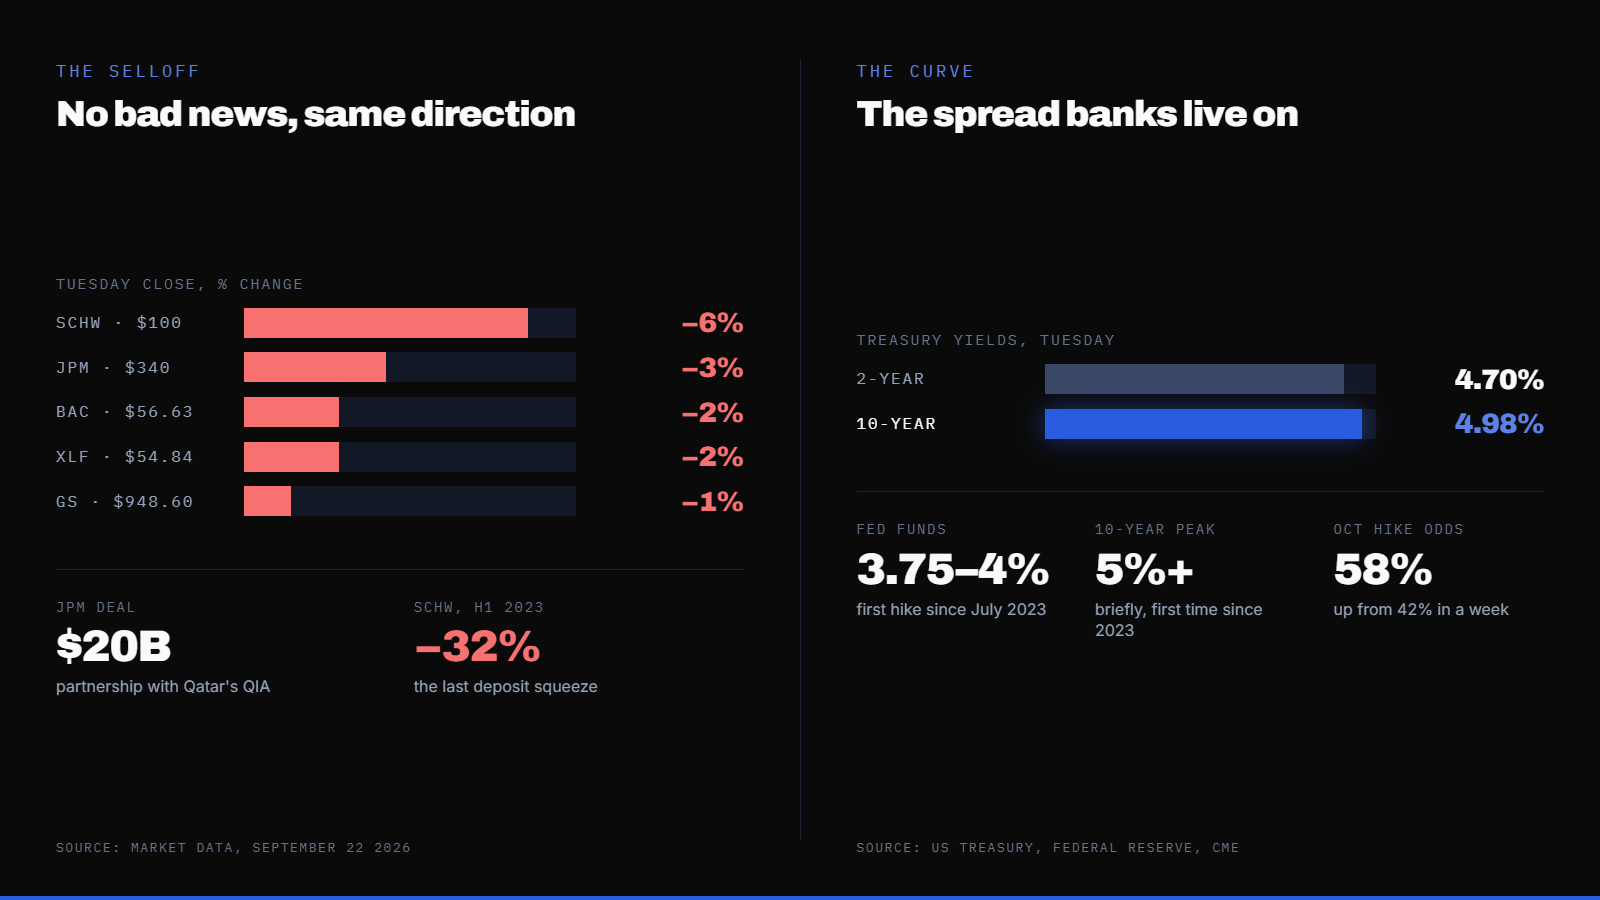
It wasn't alone. Charles Schwab dropped roughly 6% to around $100, the steepest decline among major financial names. Bank of America slipped 2% to $56.63, Goldman Sachs eased 1% to $948.60, and the Financial Select Sector SPDR ETF, which tracks the sector broadly, fell 2% to $54.84. None of these companies reported bad news of their own on Tuesday. The selling came from the bond market instead.
What Changed
The 10-year Treasury yield sat near 4.98% on Tuesday, while the 2-year traded near 4.7%. That gap, about a fifth of a percentage point, is one of the tightest spreads between the two maturities in months. Pulse24 tracked the run-up to this earlier in September, when the 10-year briefly crossed 5% for the first time since 2023. That move came a day before the Fed raised its benchmark rate to a range of 3.75% to 4.00%, its first increase since July 2023, in a unanimous vote that reversed the 9-3 split from the meeting before. The dollar jumped to a seven-week high in the same session.
Long-term yields haven't kept pace with short-term ones since. The 10-year has eased back from its intraday peak above 5% to sit just below it, while the 2-year has stayed anchored close to where the Fed left it. The result is a curve that keeps getting flatter even as the overall level of rates stays elevated, and that combination lands squarely on bank and brokerage balance sheets.
Why It Matters
Banks and brokerages make money on a spread. They pay depositors one rate and earn a higher one lending that money out or investing it in longer-dated securities. A steep curve, where long rates sit comfortably above short rates, supports that business. A flat one compresses the difference, and net interest margin, the metric that captures exactly this spread, tends to shrink along with it.
Charles Schwab faces a second, more specific version of the same pressure. A large share of its revenue comes from cash sitting in client brokerage accounts, some of which still earns a below-market rate through Schwab's own sweep program. When savers can earn more elsewhere, in a money market fund or a short-term Treasury bill, they move their cash. Analysts call this cash sorting, and it shows up on Schwab's income statement as lower net interest revenue even when total deposits look stable.
The company has faced a far more extreme version of this before. In the first half of 2023, Schwab's stock fell nearly 32% after more than $63 billion was pulled from its brokerage sweep accounts in a single quarter, a squeeze tied to a regional banking crisis and to unrealized losses sitting in Schwab's own bond portfolio. Tuesday's decline is a small fraction of that move, and nothing in the current setup resembles a banking crisis. The mechanism behind both episodes is the same one, though: cash moving toward wherever it earns the most.
What to Watch Next
Third-quarter bank earnings, due in the coming weeks, will show whether net interest margins actually moved or whether Tuesday's selling got ahead of the data. Schwab's monthly disclosures on client cash levels are worth watching specifically, since sweep balances tend to shift before headline earnings catch up. On the bond side, track the 2-year and 10-year yields together rather than in isolation. A curve that keeps flattening from here, especially if short rates climb further on rising odds of an October hike, would extend the pressure on financials even without a big change in the overall level of rates. October hike odds jumped from 42% to 58% in a single week earlier this month, and that is exactly the kind of move that pushes short-term yields up faster than long-term ones.
The Pulse24 Take
It would be easy to read Tuesday's session as a verdict on the banks themselves, especially with JPMorgan announcing new business the same day its stock fell. That reading misses what actually moved. Rate-sensitive financials benefited for much of the past two years as the curve steepened, and now a version of the same trade is running in reverse as it flattens again, largely independent of any one bank's execution. Schwab's history from 2023 is worth remembering here, not as a sign that something similar is imminent, but as a reminder that this business model has a specific weak point, one that gets tested every time the rate path shifts. The distance between that episode and this one is still large. What's worth tracking from here is whether that distance keeps shrinking.
How we read the data
Curious how we get from raw data to a take like this? Our Trader's Toolkit walks through the tools we lean on.
Explore the Toolkit