Pulse24 Original
Silver Is Down 52% From January's Record High. The Global Silver Deficit Just Got 15% Worse Anyway.
August 5, 2026
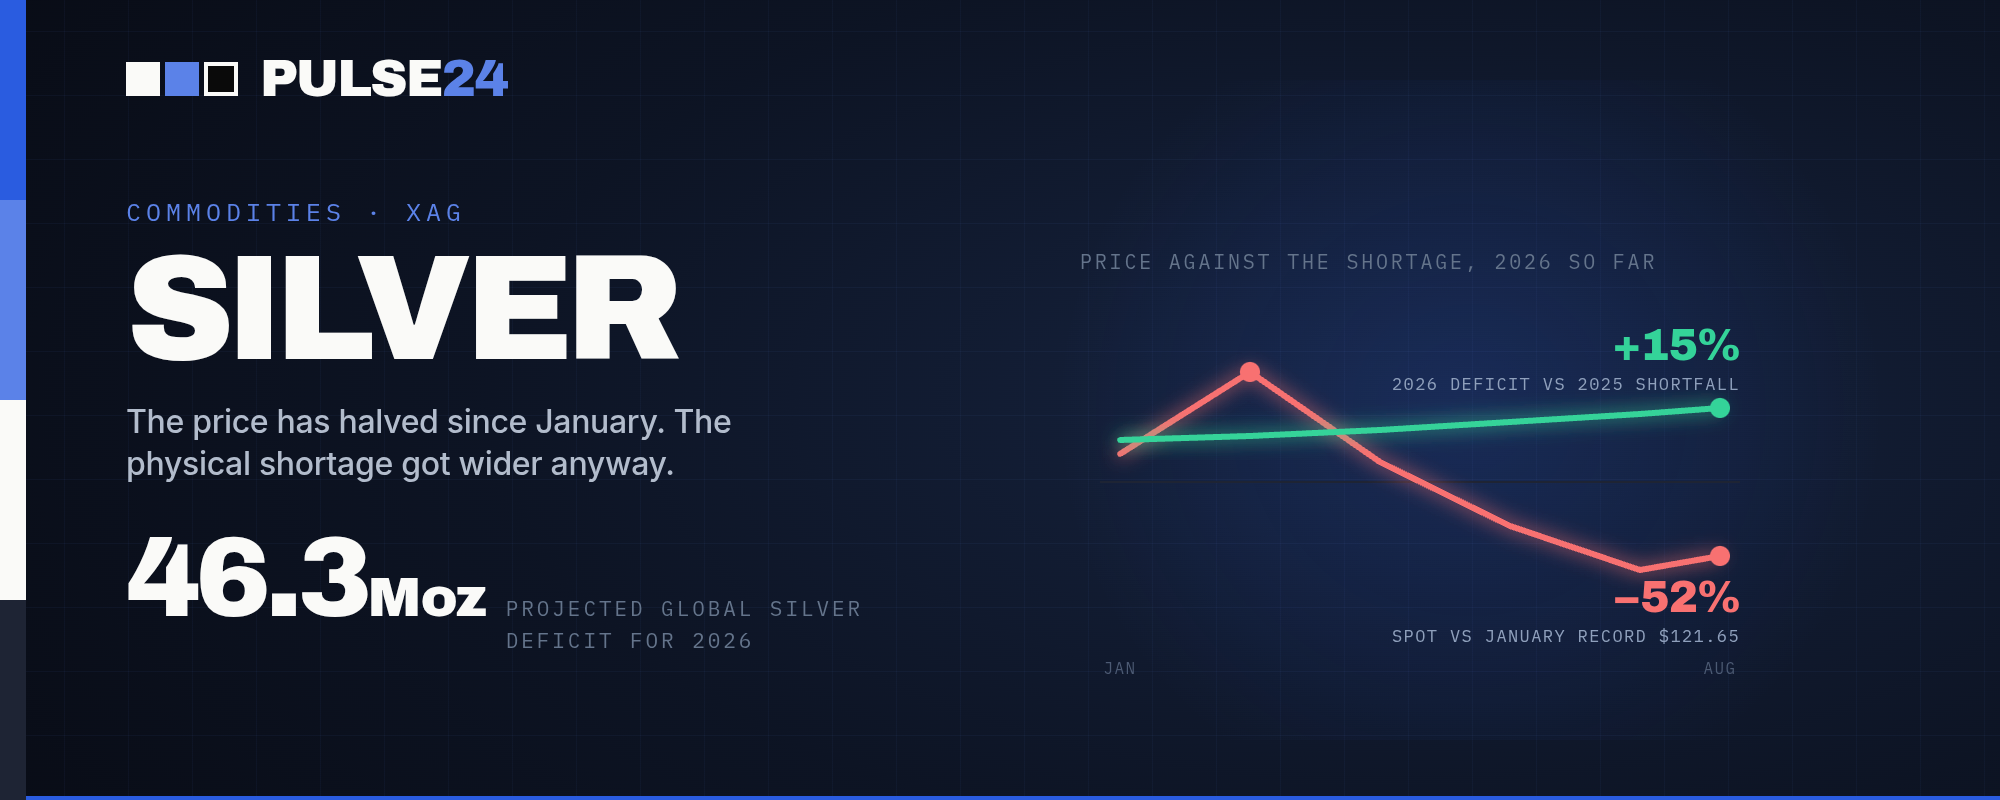
Silver traded near $59 an ounce this week, about half of January's record $121.65 high. The Silver Institute says the physical shortage widened to 46.3 million ounces anyway, a reminder that Fed policy, not scarcity, is driving the price right now.
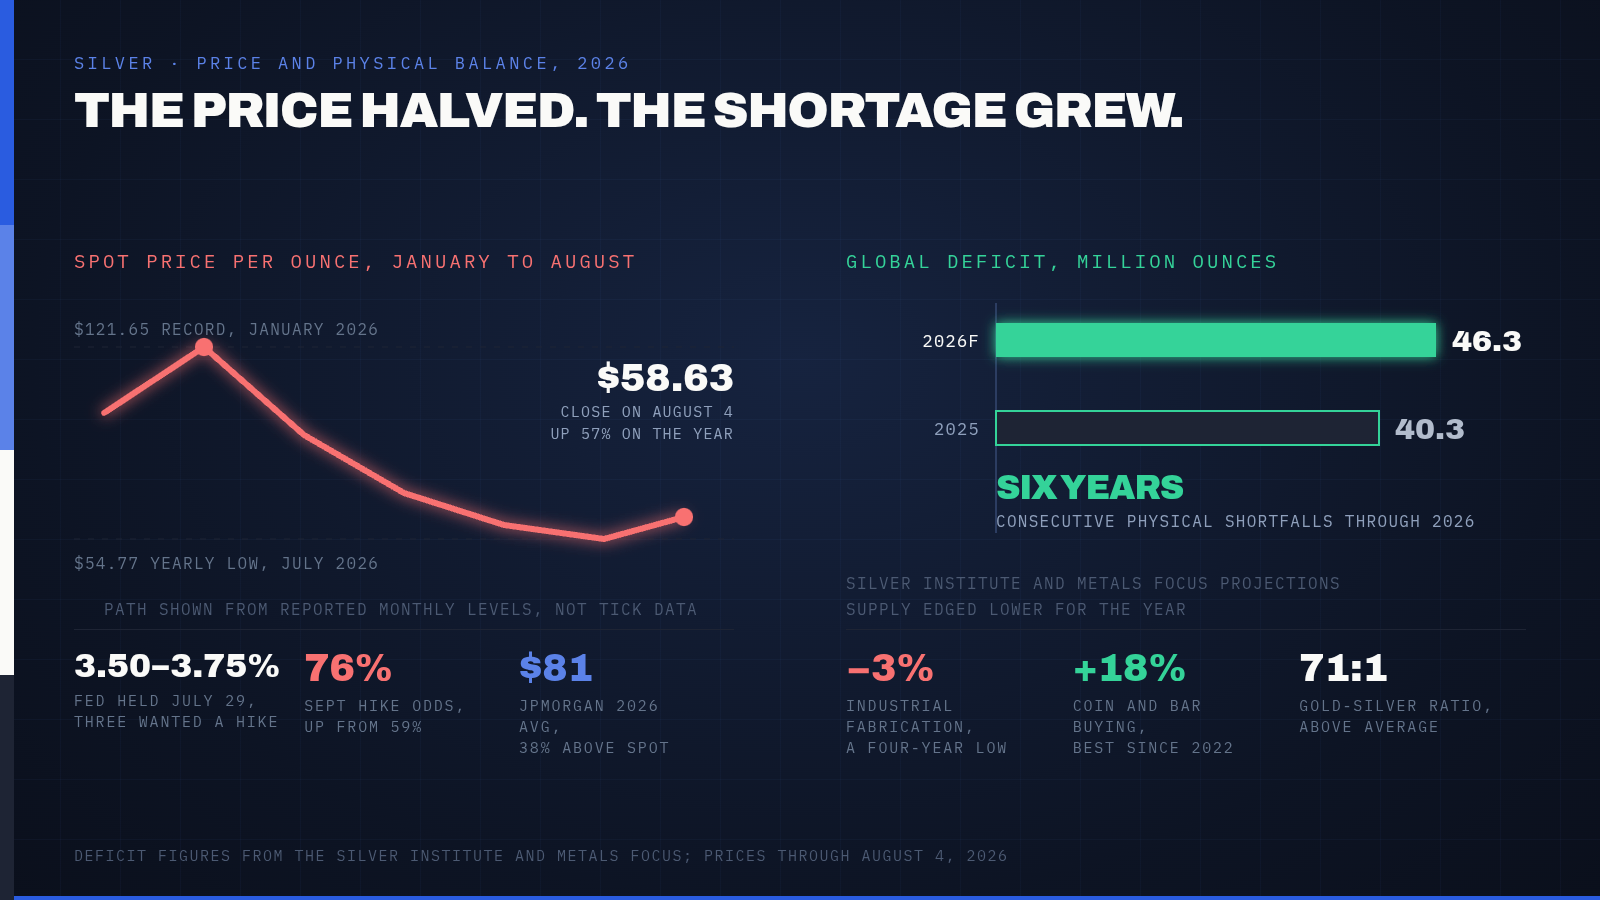
Fifty-eight dollars and sixty-three cents. That's where silver closed on August 4, a price that would have counted as a blowout record in any year before this one. In January 2026 it wasn't a ceiling at all. It was a waypoint on the way to $121.65 an ounce, the highest price silver has ever traded at.
The Round Trip
The January spike had real fundamentals behind it. Tariff threats out of Washington stoked fresh inflation fears, and buyers across solar, electronics and EV manufacturing were competing for a physical market that had already been running short for five straight years. Layer investor money chasing that deficit story on top, and silver ran further and faster than gold did on the way to its own record.
The unwind was just as sharp. Silver slid to a yearly low of $54.77 in July, more than halving from the January peak in a matter of months. A strengthening dollar did most of the damage, and a fading geopolitical risk premium pulled speculative money back out of precious metals broadly. Gold's own retreat told a similar story, down 28% from its January record even with central banks still buying near-record tonnage. The gap between the two metals has been unusually wide all year, with the gold-silver ratio recently stretching to 71 to 1, well above its long-run average.
A Deficit That Doesn't Care About Price
The disconnect is worth sitting with. The physical market got tighter while the price got cut in half. The Silver Institute and Metals Focus now project a 46.3 million ounce global deficit for 2026, up 15% from last year's 40.3 million ounce shortfall. Industrial fabrication demand actually fell, dropping 3% to a four-year low as manufacturers pulled back on consumption. Supply also edged lower for the year. Investment demand moved the opposite direction: coin and bar buying is forecast to jump 18% in 2026, the strongest pace since 2022, more than offsetting weaker industrial use.
The Silver Institute put it plainly back in April: "The crucial point, however, is that the market has clearly entered an era of reduced stocks. Tightness will not be constant, but liquidity will generally be thinner, lease rates more volatile and price moves likely to be larger." Four months and a 50% price swing later, that reads less like a warning and more like a description of what already happened.
Why the Fed Matters More Than the Deficit Right Now
Silver pays no interest, which makes it a straightforward loser whenever the Fed leans hawkish, and the Fed has been leaning hawkish all year. The central bank held its benchmark rate at 3.50% to 3.75% on July 29 for a fifth straight meeting, but the 9-3 vote undersold how close the decision actually was, with three regional presidents dissenting in favor of an immediate hike.
Fed Chair Kevin Warsh, sworn in on May 22, told Congress in mid-July that he has "no tolerance" for inflation running above target. Traders took the message seriously: odds of a September rate hike jumped to 76%, up from 59% just a month earlier. Higher rates for longer mean a stronger dollar and a bigger opportunity cost for holding a metal that generates no yield, and that combination has outweighed the deficit story for most of this year.
What to Watch Next
The Fed's September meeting is the obvious catalyst. A hike would likely pressure silver back toward its July low near $55, while a surprise hold could spark a sharp relief rally given how aggressively the market has already priced in tightening. J.P. Morgan's own 2026 average price forecast sits near $81 an ounce, about 38% above current levels, implying the bank expects at least a partial recovery once the rate picture settles. Watch for the Silver Institute's next update as well. If the deficit estimate widens further while the price stays depressed, the gap between physical scarcity and paper pricing gets harder to explain away.
The Pulse24 Take
Silver's chart looks chaotic, but the underlying lesson isn't complicated. Monetary policy sets the pace for precious metals in the short run, and physical supply and demand set the direction over years, not months. Those two forces are pulling in opposite directions right now, and the Fed is currently winning.
That doesn't make the deficit irrelevant. A market that has been short physical metal for six consecutive years doesn't fix itself just because Wall Street repriced its rate expectations. It means the deficit is a slower, quieter signal, one that tends to matter most once the Fed story stops dominating the headlines. Anyone treating $59 silver as either cheap or expensive right now should ask which force they're actually betting on, because the two aren't pointing the same way yet.
How we read the data
Curious how we get from raw data to a take like this? Our Trader's Toolkit walks through the tools we lean on.
Explore the Toolkit