Pulse24 Original
Gold Is Down 28% From January's Record. Central Banks Bought 289 Tonnes of It in a Single Quarter.
August 2, 2026
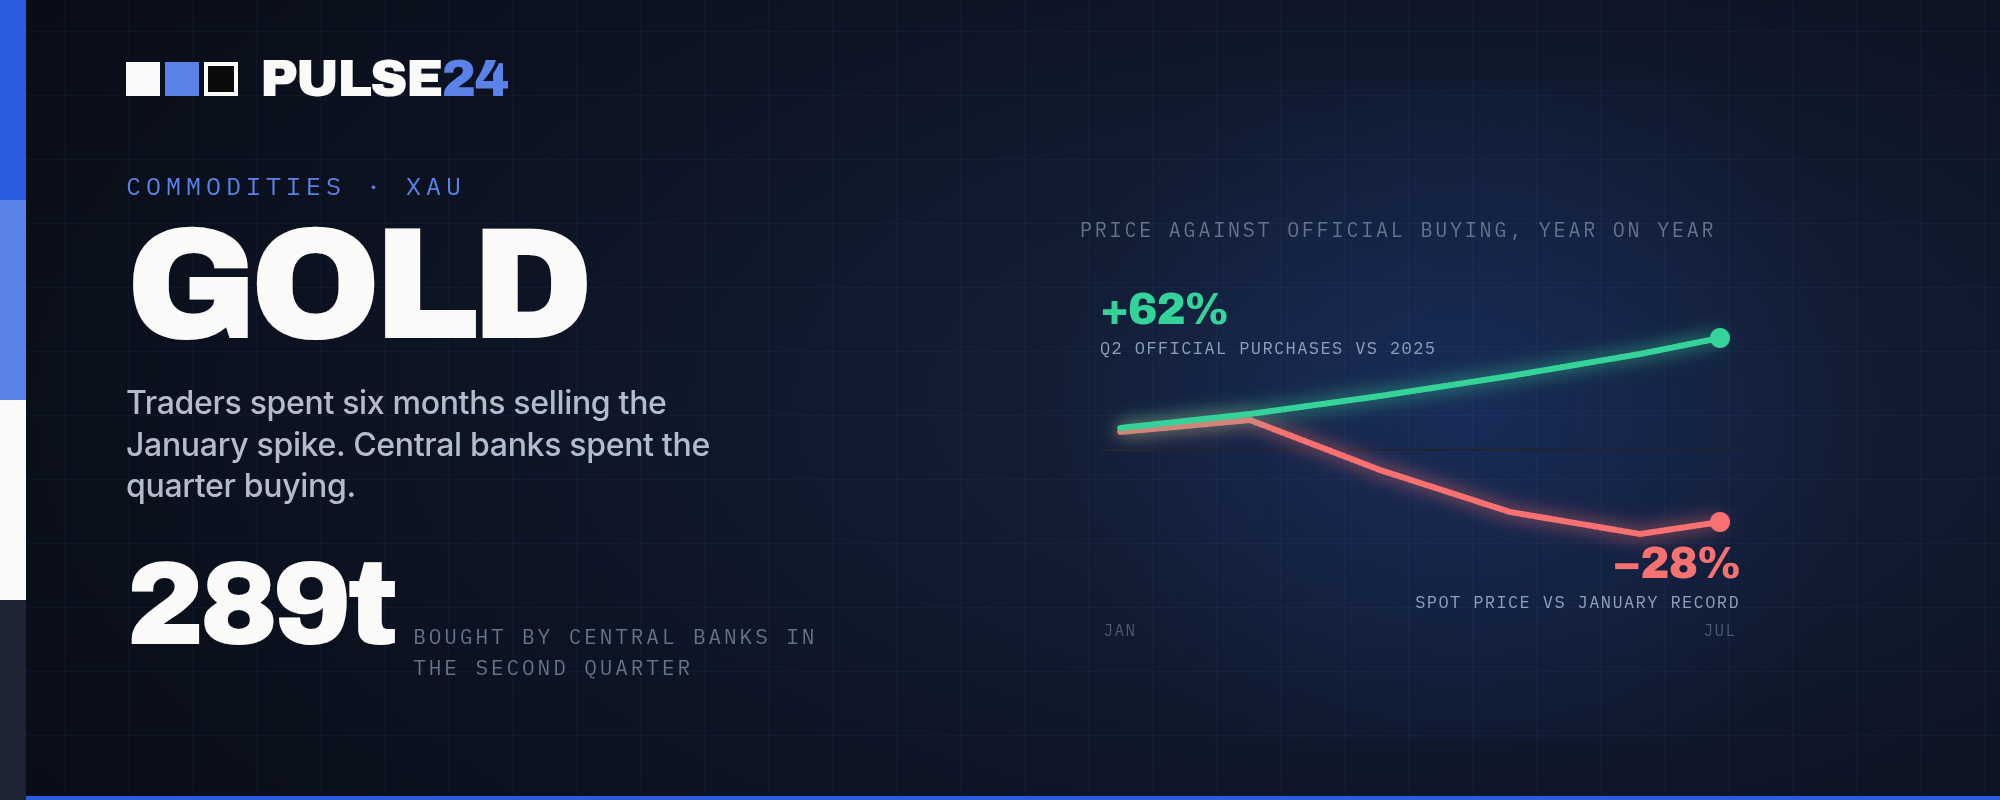
Gold closed July 28% below the record it set in January, yet central banks bought 62% more of it in the second quarter than they did a year earlier. The two trends aren't as contradictory as they look, and the gap between them explains a lot about how this gold market actually works.
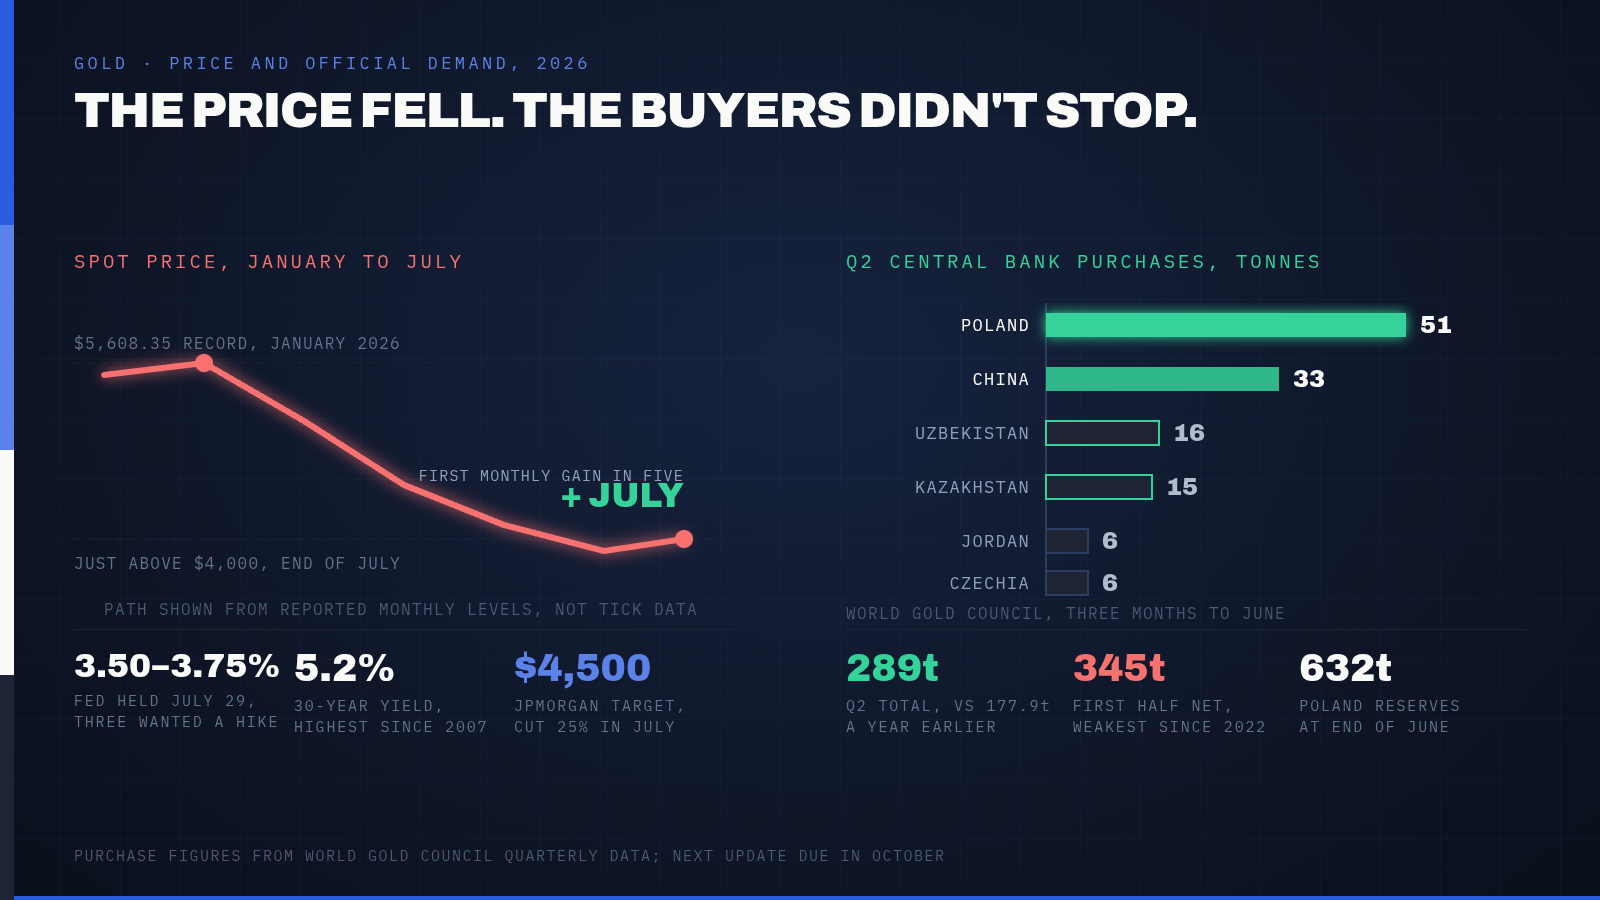
Gold ended July just above $4,000 an ounce, about 28% below the $5,608.35 record it touched in January. Six months after that spike, the metal just logged its first monthly gain in about five months, and the two facts sitting next to each other tell a more useful story than either one alone.
January's rally had a clear trigger. A rush into safe havens pushed gold within striking distance of $5,600 an ounce and dragged silver above $120, a run steep enough that traders began comparing it to speculative blow-off tops rather than an ordinary bull market. Gold didn't collapse from there so much as drift lower for months, as real yields climbed and the dollar found its footing.
Why Gold Slipped Even as the Fed Stayed Hawkish
The Federal Reserve held its benchmark rate at 3.50% to 3.75% on July 29, but the vote wasn't clean: three officials pushed for a hike instead of a hold, and bond investors read the split as evidence the central bank isn't done fighting inflation. Higher-for-longer policy typically weighs on gold, since the metal pays no yield and competes directly with Treasurys once real rates turn positive. That same day, the 30-year Treasury yield topped 5.2%, its highest level since 2007, adding another headwind.
Kevin Warsh, who took over as Fed chair earlier this year, insisted the central bank would not hesitate to act if inflation stayed sticky. Bond markets weren't fully convinced, and that skepticism showed up in gold too. A hawkish Fed that traders trust is a different animal than a hawkish Fed whose credibility is being questioned in real time, and gold's choppy summer looks like a market trying to price that difference.
The Central Bank Buying Spree Nobody Priced In
While traders were pulling back, central banks did the opposite. They bought 289 tonnes of gold in the second quarter, according to World Gold Council data, 62% more than the 177.9 tonnes they bought in the same quarter of 2025.
Poland led the buying, adding 51 tonnes to push its reserves to 632 tonnes by the end of June. China's central bank added 33 tonnes, its largest single-quarter purchase since the fourth quarter of 2023. Uzbekistan added 16 tonnes, Kazakhstan added 15, and Jordan and the Czech Republic each added 6. The list of buyers keeps including countries that weren't regular participants a few years ago.
The first half of the year tells a messier story than the second quarter alone. Total net demand from central banks was just 345 tonnes through June, the weakest first half since 2022, because Turkey and Russia sold heavily in the first quarter. Zoom in and the second quarter looks like a rebound. Zoom out and 2026 looks like a year where some governments are buying gold to hedge dollar exposure while others are selling it to cover budget gaps, with both motives playing out inside the same twelve months.
What to Watch Next
JPMorgan cut its own gold price target 25% in late July, to $4,500, when the metal was trading near $4,098. That target now sits roughly 11% above where gold actually closed the month, a reminder of how quickly even large trading desks have had to revise their assumptions this year. The next real data point is the World Gold Council's third-quarter report, due in October, along with whatever the Fed signals about whether July's split vote was a one-off or the start of a pattern. AMD reports earnings on August 4, and while that won't move gold directly, it will help set the risk tone that's been quietly supporting demand for safe havens all summer.
The Pulse24 Take
Gold down 28% from a January spike sounds like a broken trade. Central banks buying 62% more of it than a year ago sounds like conviction. Both are true, and the gap between them comes down to time horizon. Traders who bought near $5,600 got caught by a speculative peak, and the metal has spent six months working that excess out of its price. Those buying steadily through the year are doing something else entirely: hedging currency and reserve exposure on a multi-year view rather than calling a top or a bottom.
For markets, that split matters more than either headline number does on its own. Gold's near-term price will keep tracking real yields and the dollar, the way it always has, while the structural buyer underneath the market provides a floor that's sturdier than retail sentiment alone would suggest. Neither dynamic guarantees a direction from here. Anyone treating $4,000 gold as either a floor or a ceiling based on the last six months of price action is reading less signal than the data actually contains.
How we read the data
Curious how we get from raw data to a take like this? Our Trader's Toolkit walks through the tools we lean on.
Explore the Toolkit