Pulse24 Original
Silver Fell 3% This Week While Gold Held Its Ground. The Gap Between Them Just Widened to 71 to 1.
July 29, 2026
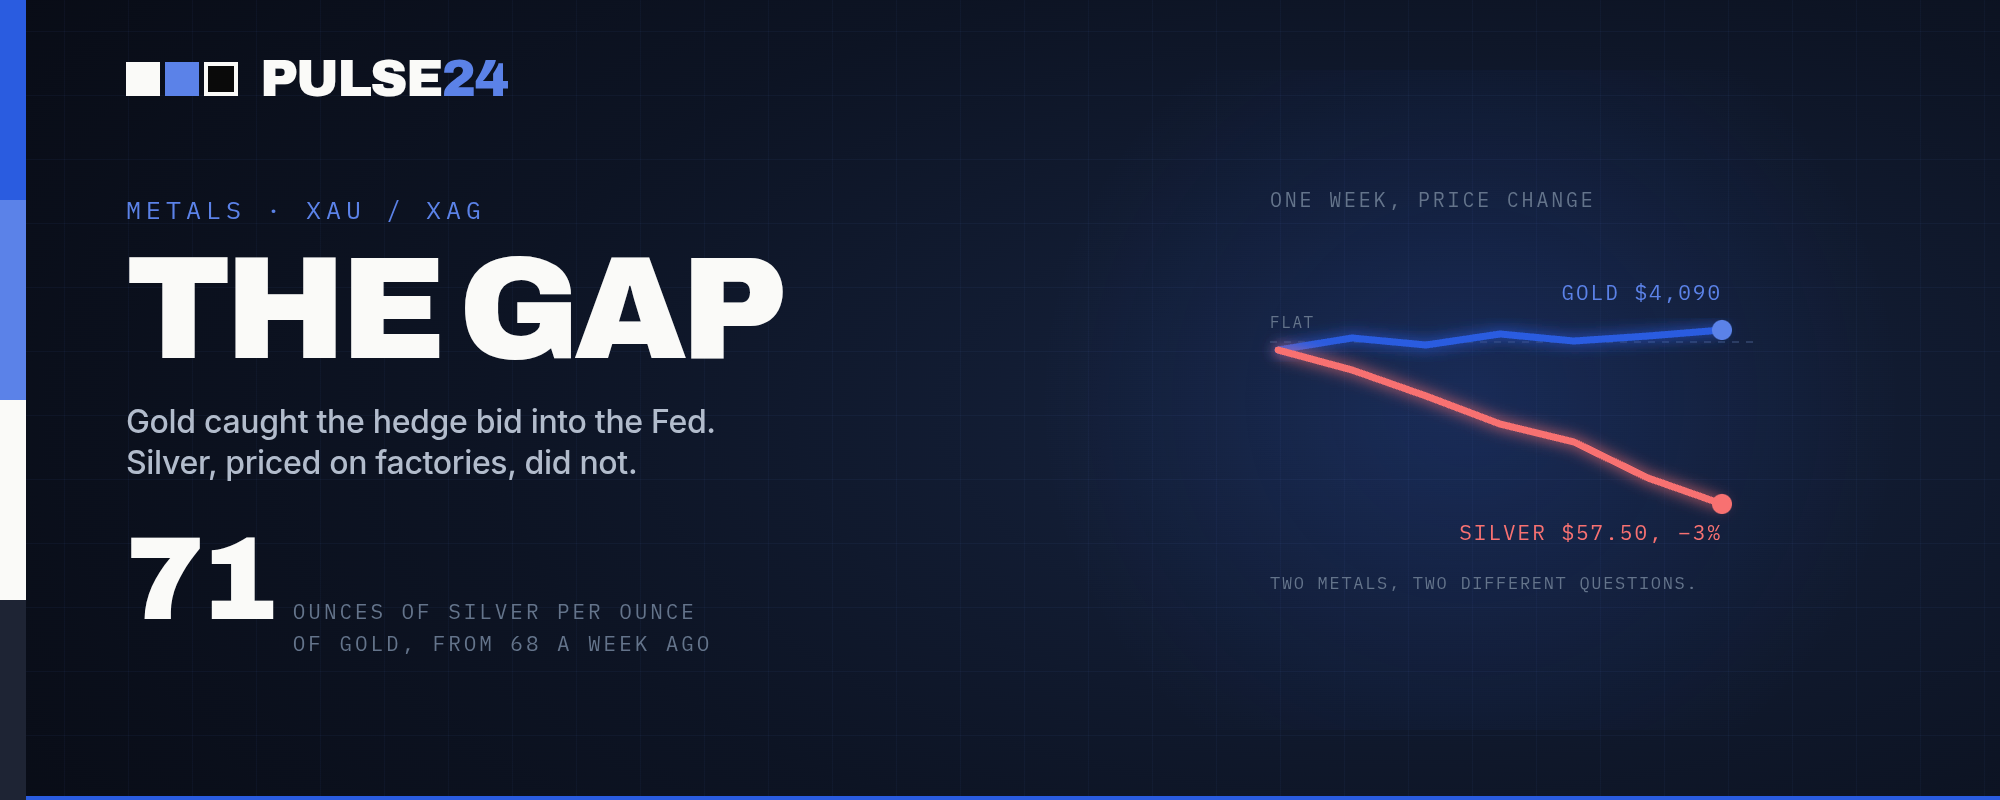
Gold is holding near $4,090 an ounce while silver has slipped to about $57.50, pushing the gold-to-silver ratio from around 68 to roughly 71 in under a week. The split says as much about industrial demand and growth expectations as it does about today's Fed decision.
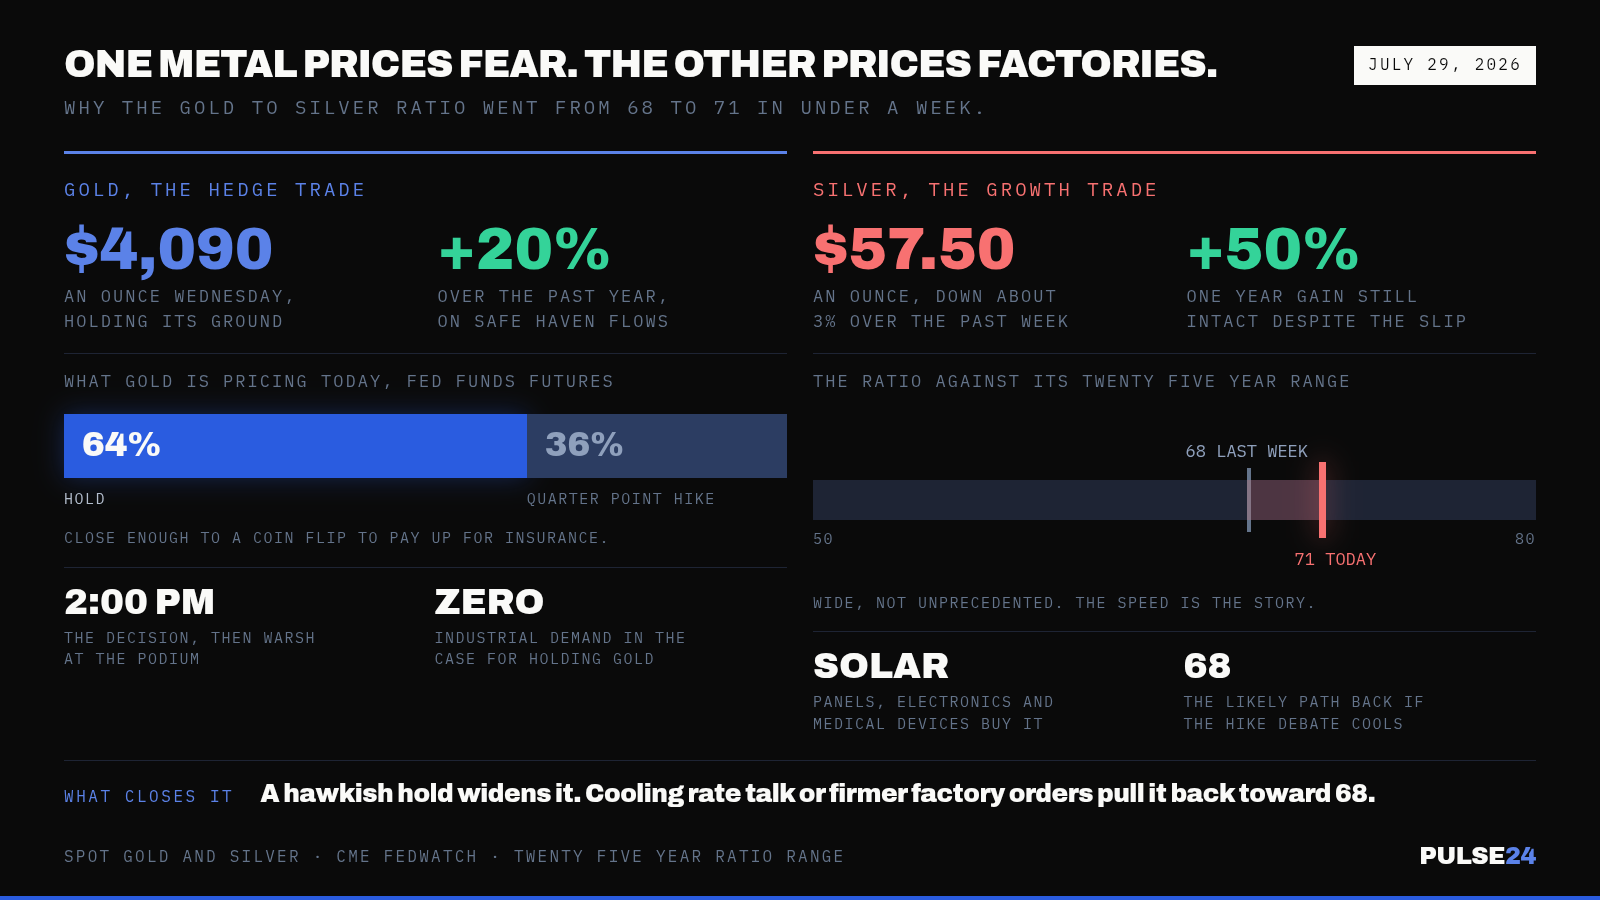
Gold is trading near $4,090 an ounce this morning, holding a gain of roughly 20% over the past year. Silver isn't keeping pace. It has slipped to around $57.50 an ounce, down close to 3% over the past week, even though its own one-year gain still tops 50%.
What Changed
About a week ago, the gold-to-silver ratio, the number of silver ounces it takes to buy one ounce of gold, sat near 68, a level consistent with where it has traded for most of the past two decades. This week it climbed to roughly 71. That's not a dramatic break by historical standards; the ratio has swung between roughly 50 and 80 over the past twenty-five years without drawing much notice. But a move of that size in under a week happened fast, and for a reason that has less to do with today's headline event than it might appear.
Gold did what gold typically does when the calendar gets crowded. Investors bought it as a hedge heading into the Federal Reserve's rate decision, due around 2pm ET, with futures pricing roughly a 64% chance of a hold and a 36% chance of a quarter-point hike. Silver got no equivalent bid. It drifted lower instead, tracking softer industrial sentiment rather than the safe-haven flows lifting gold.
Why It Matters
Silver carries a different demand profile than gold. A meaningful share of its buying comes from manufacturing: solar panels, electronics, medical devices, and a long list of industrial uses that have nothing to do with portfolio hedging. Gold trades almost entirely as a store of value. When the ratio between them widens quickly, the move is often less about precious metals specifically and more about how investors are separating fear from growth optimism. A wider ratio here leans toward the fear side, consistent with the elevated equity volatility already showing up elsewhere this week.
That split matters heading into a Fed decision priced about as close to a coin flip as any meeting in recent memory. A hawkish outcome would likely firm the dollar and real yields, which tends to weigh on both metals. But silver, already showing industrial-demand-driven weakness, would probably underperform gold again rather than close the gap.
What to Watch Next
The Fed's statement and Chair Kevin Warsh's press conference land this afternoon, and the cross-asset reaction is likely to say more than the vote itself. A hold paired with hawkish language could push the ratio wider still, since that combination tends to support gold's hedge appeal while doing little for silver's industrial case. A softer tone, or any sign the hiking debate is cooling, would be the more likely path back toward 68.
Beyond the Fed, industrial data is worth tracking on its own terms. Solar installation figures, electronics manufacturing orders, and mining supply reports all move silver independent of what happens to gold, and a pickup in any of them could narrow the ratio regardless of this week's rate decision.
The Pulse24 Take
A ratio move from 68 to 71 isn't the kind of number that makes headlines by itself, and it shouldn't. What makes it worth watching is what it measures. Gold and silver are pricing different questions right now: one about fear heading into a Fed decision, the other about industrial demand that has little to do with interest rates. When two assets that usually move together start pulling apart, the gap tends to close eventually. Which direction it closes in matters more than today's Fed decision on its own.
For now, the metals market is telling a quieter story than the one playing out in equities and rates. Investors aren't panicking. They're being selective about which kind of insurance they're willing to pay up for, and gold is currently winning that argument.
How we read the data
Curious how we get from raw data to a take like this? Our Trader's Toolkit walks through the tools we lean on.
Explore the Toolkit