Pulse24 Original
The Case-Shiller Index Rose 1.5% in June, Its Third Straight Month of Acceleration. Adjusted for Inflation, Home Values Have Fallen for 13 Consecutive Months.
August 26, 2026
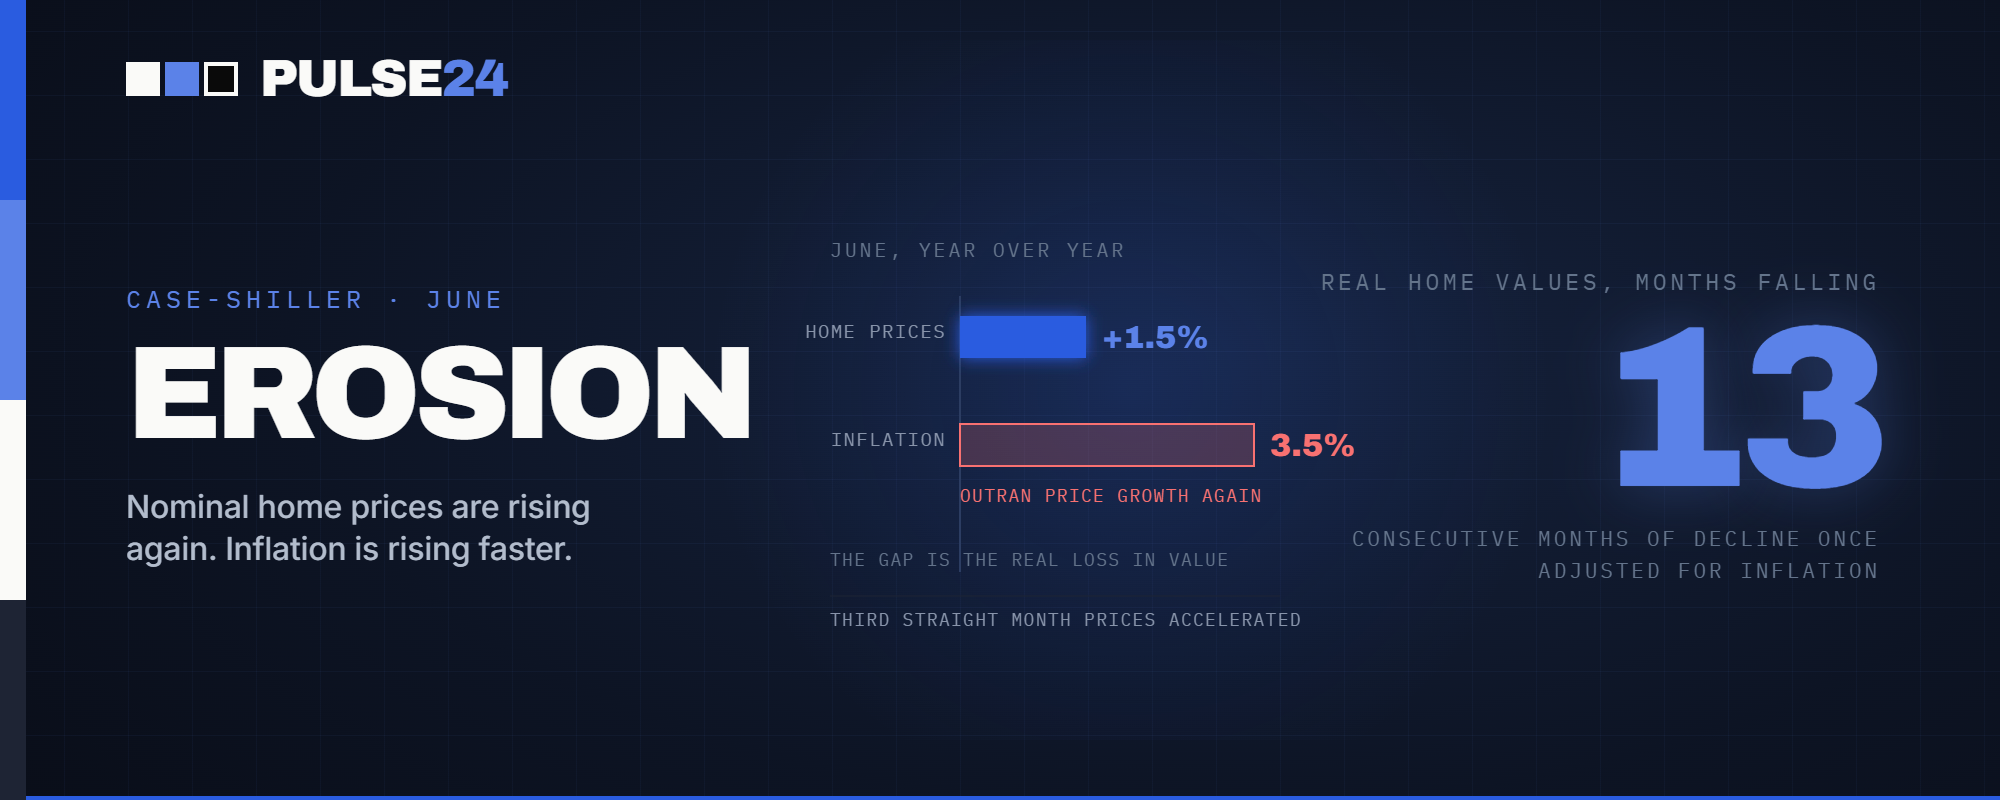
Nominal home prices accelerated again in June to a 1.5% annual pace, the third straight month of improvement, but June's 3.5% inflation rate outran that gain again. Regional splits are widening too, with Chicago up nearly 7% while Seattle keeps falling.
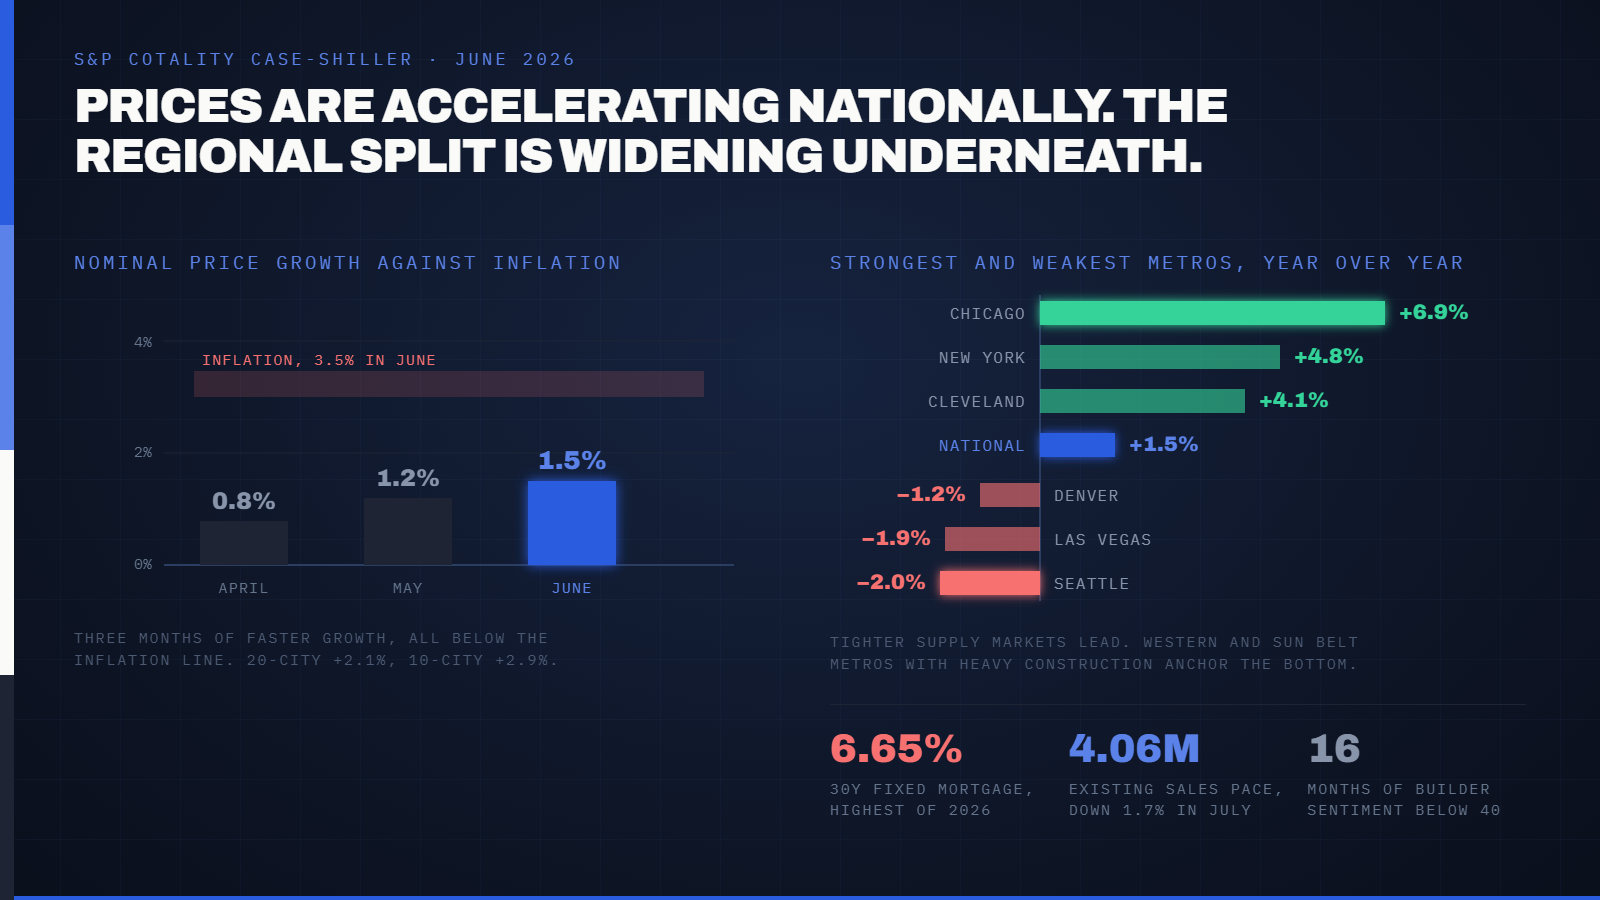
Home prices rose 1.5% nationally in the year through June, according to the S&P Cotality Case-Shiller Index released Tuesday. That's the third straight month the pace has accelerated, up from 0.8% in April and 1.2% in May. On paper, that looks like a housing market finding its footing. Adjust for inflation, though, and the story reverses entirely: real home values have now fallen for 13 straight months, according to S&P Dow Jones Indices.
What Changed
June's inflation rate came in at 3.5%, comfortably ahead of the 1.5% nominal price gain the index recorded. Rebecca Kaufman, associate director at S&P Dow Jones Indices, put it plainly in the release: home prices continue to decline in real terms, though lower inflation and firmer nominal growth in June did slow the pace of that erosion compared to prior months. Two consecutive months of cooler price pressure have not been enough to close the gap.
The 10-City and 20-City Composites told a similar story at a faster clip, up 2.9% and 2.1% year-over-year respectively, both accelerating from May. Underneath the national number, the regional split kept widening. Chicago posted the strongest reading in the index at 6.9%, trailed by New York at 4.8% and Cleveland at 4.1%, all Rust Belt and Northeast markets with tighter supply. Seattle, Las Vegas, and Denver anchored the bottom, down 2.0%, 1.9%, and 1.2%, respectively, three Western and Sun Belt metros where new construction has kept pace with, or outrun, demand.
Mortgage rates are a big part of why. Freddie Mac's 30-year fixed average sat near 6.65% in mid-August, up from 6.54% in July and the highest print of the year. Long-term Treasury yields, which set the floor under mortgage pricing, have recently traded at their highest level since 2007, and that pressure has fed straight through to what buyers pay each month. Existing home sales fell 1.7% from June to a 4.06 million annualized rate in July, even as the median sale price rose 2.0% to $434,100.
Why It Matters
A housing market that looks stable on the surface but keeps losing ground in real terms is a tougher problem to fix than one that's simply falling. Nominal price growth gives sellers and lenders cover to describe the market as healthy, and headline numbers like Tuesday's 1.5% gain will get read that way in plenty of places. But a homeowner who bought in 2022 and has watched their equity's purchasing power shrink for 13 straight months experiences something closer to a slow leak than a soft landing, and that gap between the nominal narrative and the real one tends to show up eventually in consumer behavior, not just in an index.
Builders are already behaving like the leak is real. The NAHB/Wells Fargo Housing Market Index ticked up to 35 in August from 34, but it has held below the neutral 50 mark for well over a year and below 40 for 16 consecutive months. NAHB's chief economist noted that at least three in ten builders have now cut prices to support demand for 16 straight months running, which is a longer stretch of discounting than the headline confidence number alone would suggest. Homebuilder margins compress when incentives replace price increases as the tool for moving inventory, and that eventually shows up in construction employment and materials orders too.
Commercial real estate hasn't been spared either. Landlords refinancing this year have been trading loans priced near 4% for new debt above 6.5%, the same rate backdrop weighing on residential mortgages. Both markets are being squeezed by the same mechanism: a Fed funds rate that's held at 3.5% to 3.75% since July, and long-term yields that have stayed elevated regardless of what the short end does.
What to Watch Next
Wednesday brings the PCE price index, the Fed's preferred inflation gauge and arguably the week's most consequential data point. A hotter-than-expected reading would make it harder for mortgage rates to ease from their current 6.65% perch, since long yields tend to move with inflation expectations well before the Fed's own rate decisions catch up. A cooler print would do the opposite, and quickly.
New Fed Chair Kevin Warsh delivers his first Jackson Hole speech on Friday, and whatever tone he strikes on the path for rates will filter into mortgage pricing within days, not months. Housing has become one of the clearest transmission channels for Fed policy in this cycle, arguably more direct than stocks or credit spreads, because nearly every prospective buyer feels a rate move show up in a monthly payment quote almost immediately.
Beyond that, watch whether the regional divergence in Tuesday's data keeps widening. If Sun Belt and Western metros keep softening while Midwest and Northeast cities keep accelerating, it will say less about the national housing market and more about two different housing markets that happen to share one index.
The Pulse24 Take
The headline number here is easy to misread. A 1.5% nominal gain sounds like recovery, and after a stretch of flat-to-negative readings earlier in the cycle, it will get treated that way in a lot of coverage this week. The real-terms number tells a more useful story: prices are still losing ground against inflation, they have been for over a year, and the acceleration in the nominal figure has done more to slow that decline than to reverse it.
What makes this cycle unusual is how little control the Fed's own overnight rate seems to have over any of it. Mortgage pricing is tracking the 30-year Treasury, not the fed funds rate, and that Treasury yield has been driven as much by fiscal issuance and inflation expectations as by anything the FOMC has voted on this year. Builders have adapted by discounting rather than waiting for rates to fall, which has kept sales from collapsing but has also kept their margins under pressure for going on a year and a half now. Whether that trade-off holds through the fall likely depends less on Wednesday's PCE report than on where the 30-year yield sits three months from now, and that's a number nobody, including the Fed, fully controls.
How we read the data
Curious how we get from raw data to a take like this? Our Trader's Toolkit walks through the tools we lean on.
Explore the Toolkit