Pulse24 Original
Commercial Real Estate Distress Just Climbed for a Third Straight Month to 10.91%. Landlords Refinancing This Year Are Trading 4% Loans for Rates Above 6.5%.
August 17, 2026
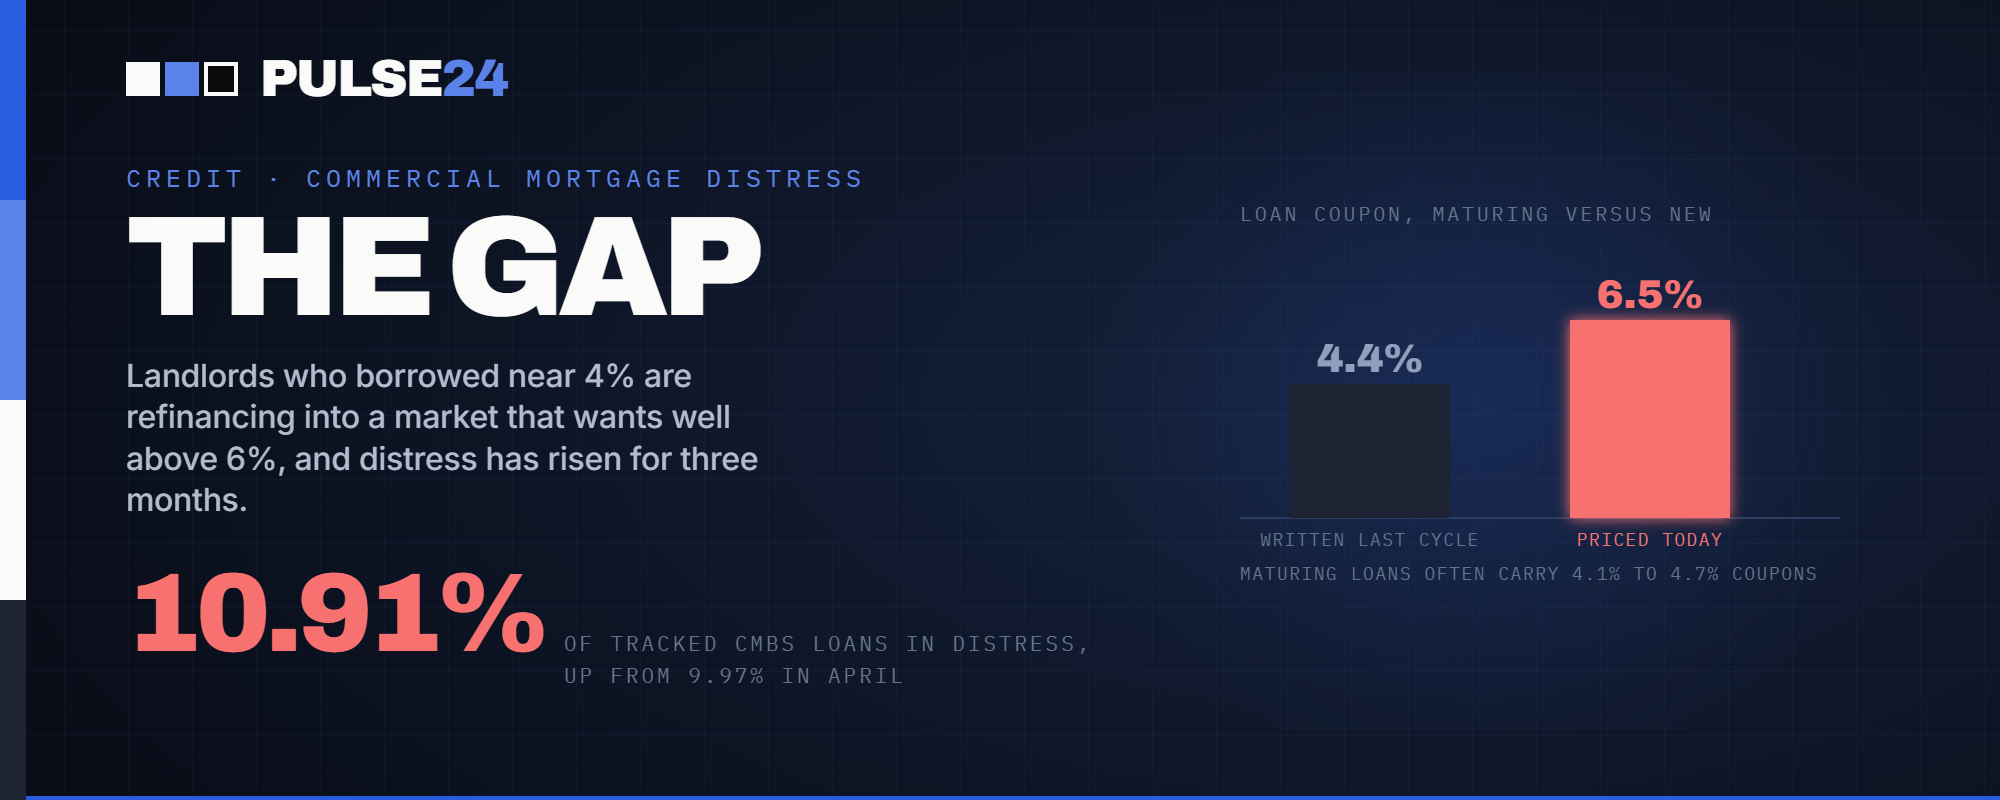
CMBS distress rose to 10.91% in July, the third straight monthly increase, with office properties running more than 50% above the market average. The real pressure isn't defaults yet, it's a refinancing gap: loans written near 4% are coming due into a market pricing new debt above 6.5%.
Commercial mortgage distress just notched its third straight monthly increase. CRED iQ's July reading puts 10.91% of tracked CMBS loans in some form of distress, delinquent, in special servicing, or both, up from a brief reprieve of 9.97% in April. It's not a record for the year. March's reading ran higher. But the direction is what's drawing attention: three months of steady deterioration after a spring that looked like it might be stabilizing.
What Changed
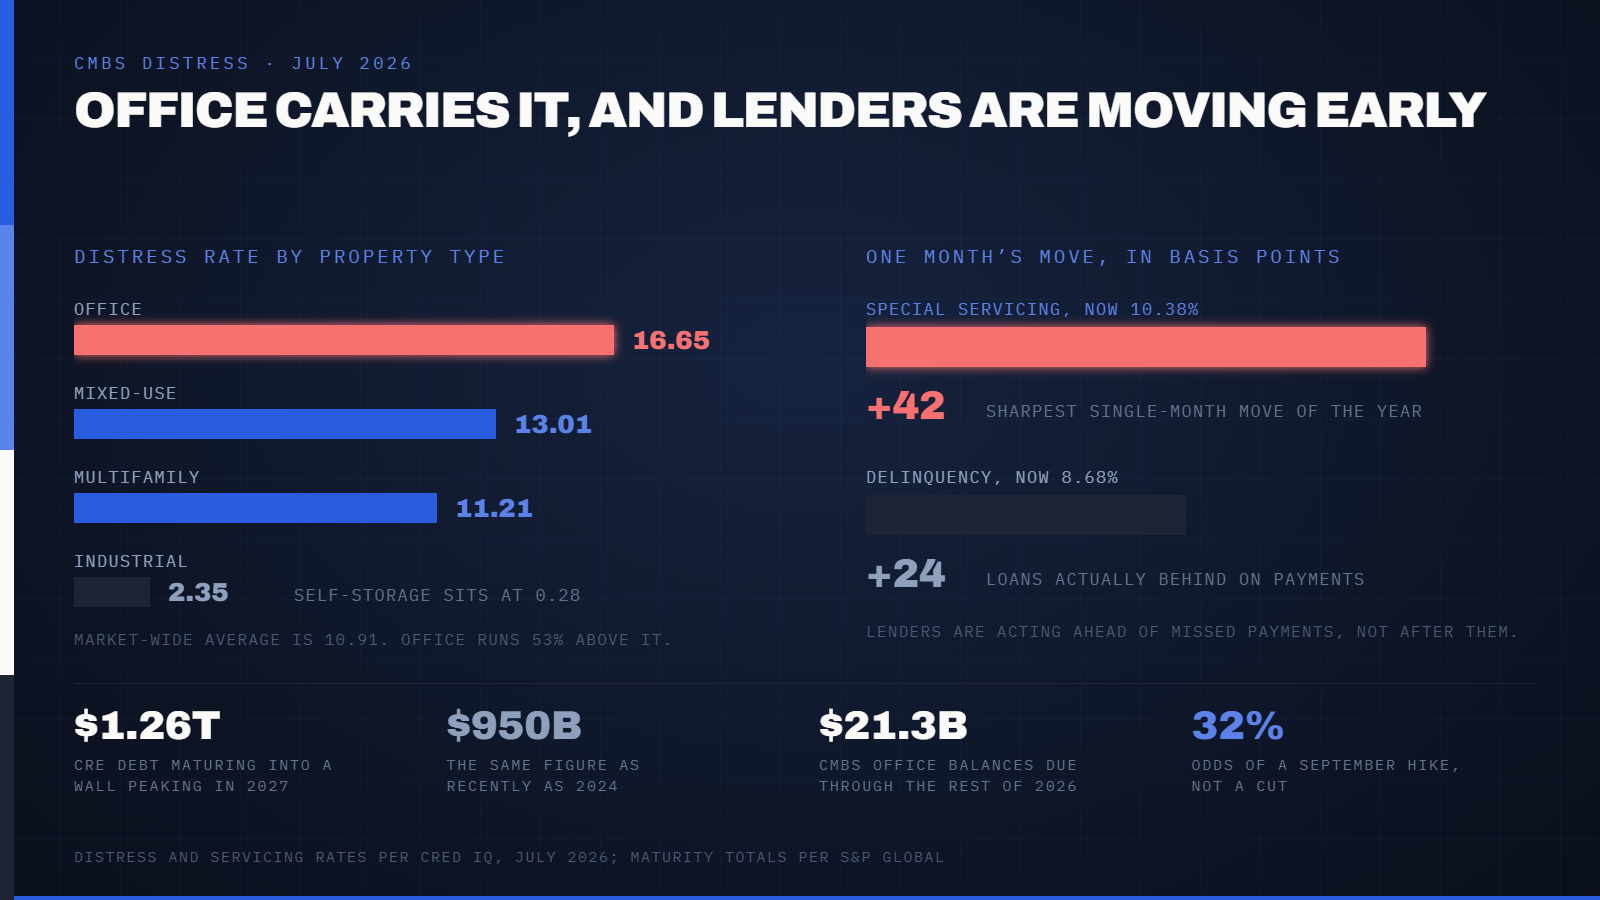
The headline number splits into two pieces that tell different stories. Delinquencies, loans actually behind on payments, rose 24 basis points to 8.68%. Special servicing, where a loan gets transferred for closer management before it's necessarily in default, jumped 42 basis points to 10.38%, the sharpest single-month move of the year. When special servicing outpaces delinquency by that much, it usually means lenders are acting ahead of trouble rather than reacting to it. Borrowers are flagging upcoming maturities they can't refinance on current terms, requesting relief, or triggering cash management provisions written into their loan documents years ago.
Office remains the sector doing most of the damage. Its distress rate sits at 16.65%, more than half again the market average. Mixed-use properties, which often carry meaningful office exposure of their own, come in at 13.01%. Multifamily, generally the most resilient CMBS category through this cycle, has drifted up to 11.21%. Industrial and self-storage remain the outliers on the healthy side, at 2.35% and 0.28% respectively, a reminder that this is a story about specific property types rather than commercial real estate broadly.
Why It Matters
The number worth sitting with isn't the distress rate itself. It's the interest rate gap sitting underneath it. Loans originated during the last cycle's low-rate years often carry coupons in the 4.1% to 4.7% range. Refinance that same loan today and a borrower is likely looking at something closer to 6.5%. For a landlord whose property income hasn't grown enough to absorb a rate increase of that size, the choice narrows to three options: bring fresh equity to the table, negotiate an extension with the existing lender, or hand the keys back.
That gap is why the maturity wall matters more than any single month's distress reading. S&P Global puts total commercial property debt coming due through the peak of this cycle at roughly $1.26 trillion, up from $950 billion as recently as 2024, with the heaviest year still ahead in 2027. CMBS office exposure alone runs an estimated $21.3 billion in loan balances through the remainder of 2026. None of that has to end badly. Lenders have spent the past several years extending and modifying loans rather than forcing sales, and that pattern shows little sign of changing. But extend-and-pretend works best when rates are heading down, giving borrowers a fixed date when refinancing gets easier. Traders put the odds of a September Fed rate hike near 29% earlier this month, and that figure has since drifted up to roughly 32%, not toward a cut, with the fed funds range sitting at 3.5% to 3.75% since June. A borrowing environment that isn't clearly easing is the one scenario extend-and-pretend handles worst.
What to Watch Next
Watch the gap between special servicing and delinquency rates in CRED iQ's coming monthly reports. A narrowing gap would suggest today's proactive loan transfers are turning into actual missed payments. A widening one, alongside a stable delinquency rate, would support the read that this is lenders getting ahead of a problem rather than falling behind one. The Fed's July meeting minutes, due Wednesday, are also worth a look for anything that shifts the rate path CRE borrowers are refinancing into. And keep an eye on office-heavy metro markets specifically. National averages can mask how concentrated this stress already is in a handful of downtown submarkets still absorbing the shift to hybrid work.
The Pulse24 Take
It's tempting to read a rising distress number as an early warning of the next 2008. It probably isn't that, at least not yet. Multifamily and office are under real pressure, but industrial and self-storage are barely moving, and the special servicing jump looks more like lenders managing risk early than a market losing control. What's more interesting than the headline percentage is the mechanism underneath it: a wall of debt written at 4% rates meeting a lending market that wants 6.5%, with no clear signal on when, or whether, that gap closes. Rate cuts would help enormously. Right now the market is debating a hike instead. That's the detail that will decide whether this stays a slow, manageable grind through 2027 or turns into something sharper.
How we read the data
Curious how we get from raw data to a take like this? Our Trader's Toolkit walks through the tools we lean on.
Explore the Toolkit