Pulse24 Original
$746 Million Left Bitcoin ETFs in Two Days. Bitcoin's Price Barely Noticed.
September 17, 2026
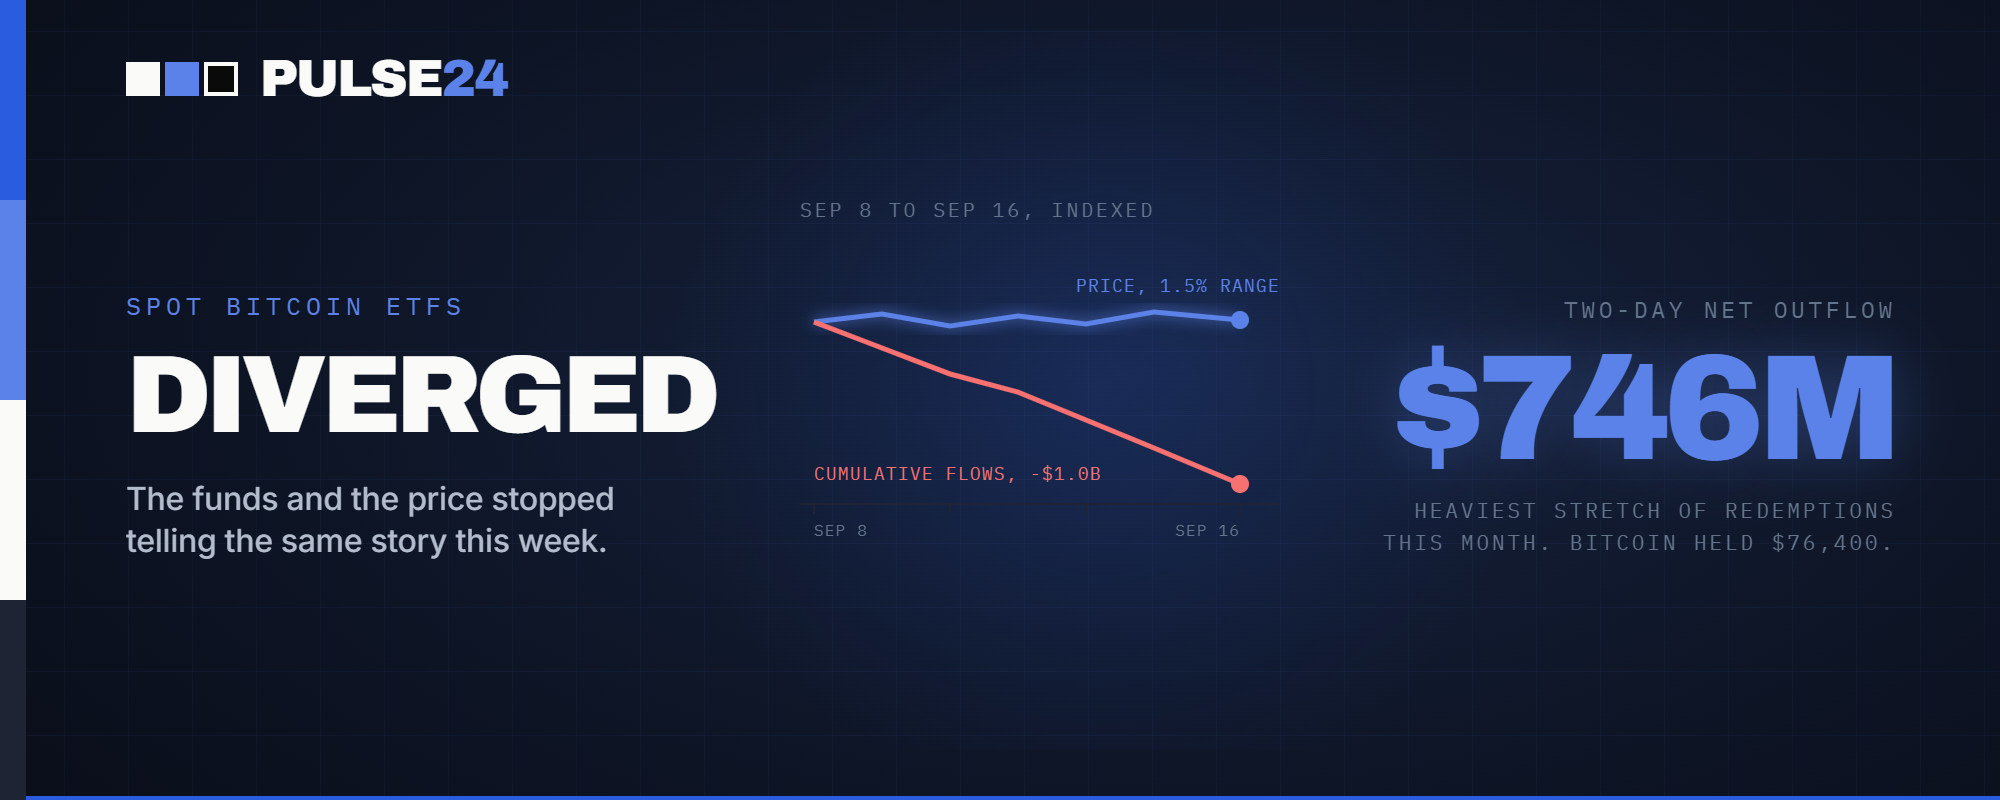
U.S. spot Bitcoin ETFs shed $746 million in the two sessions after this week's Fed rate hike, their sharpest stretch of selling this month. Bitcoin's price moved just 1.5% over the same span, and that gap between what the funds are doing and what the price is doing is worth understanding before reading too much into either one.
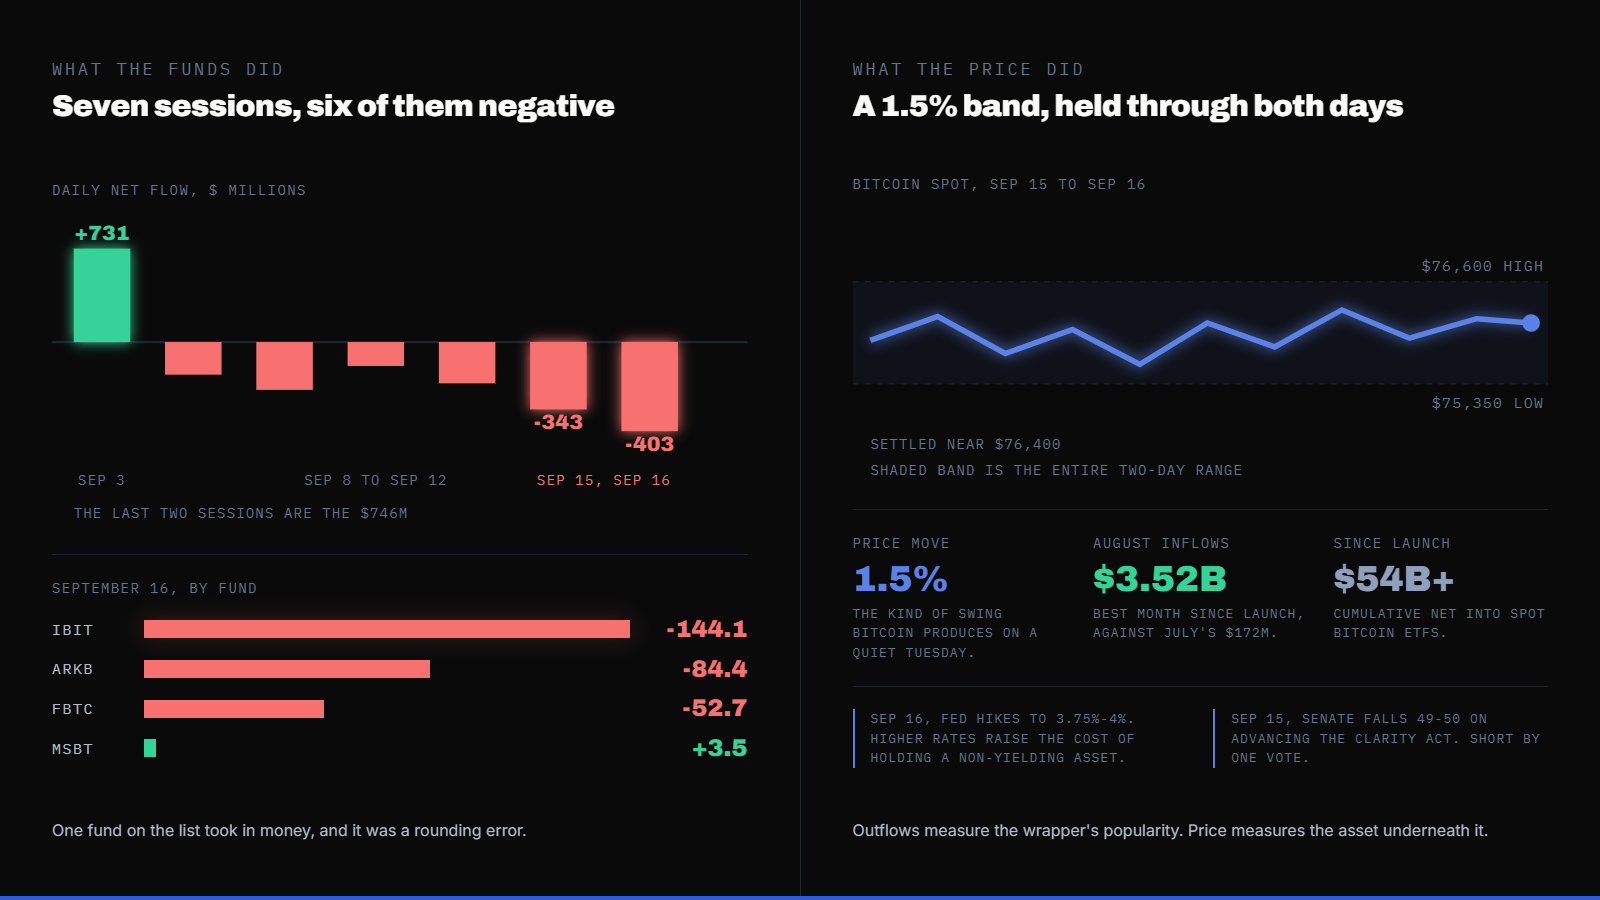
$746 million. That's the combined sum that walked out of U.S. spot Bitcoin ETFs on September 15 and 16, the two trading sessions immediately following the Fed's first rate increase in three years. BlackRock's IBIT alone gave up $144.1 million on the second day; Fidelity's FBTC lost another $52.7 million; ARK's ARKB shed $84.4 million. Only Morgan Stanley's tiny MSBT logged a gain, and it was $3.5 million, barely a rounding error against the outflow sitting next to it.
Bitcoin's own price, the thing all of that money is supposedly chasing, did not confirm the alarm. It spent both sessions in a tight band, $75,350 on the low end and $76,600 on the high, before settling near $76,400. That's a move of about 1.5%, the kind of daily wiggle bitcoin produces on a quiet Tuesday, not what you'd expect if institutional money were fleeing the asset itself rather than just the wrapper built around it.
What Changed
Zoom out past the two-day figure and the pattern gets more interesting, not less. Six of the seven trading sessions between September 8 and September 16 closed with money leaving the ETFs, a stretch that added up to a little over $1 billion in net withdrawals. September 3 was the outlier, a single day when $730.8 million came in, the strongest inflow of the month. Everything since has trended the other way.
August looked nothing like this. Spot Bitcoin ETFs took in $3.52 billion that month, versus just $172 million in July, while bitcoin itself climbed roughly 25%, pushing above $80,000 before slipping back under $77,000 as September opened. The funds and the price were moving together then. Three weeks later, they've come apart.
Why the Flow and Price Split Matters
An ETF outflow does not delete bitcoin from existence. It means an authorized participant redeemed fund shares for the underlying coin or its cash equivalent, which is a statement about who wants exposure through a brokerage account versus who's comfortable holding the asset directly, more than it is a verdict on bitcoin's price. That distinction is exactly why the two data points can diverge the way they did this week: outflows measure a wrapper's popularity, price measures the asset underneath it, and for two days those told different stories.
The timing is what makes this worth watching rather than shrugging off. Wednesday's Fed decision lifted the funds rate to 3.75%-4%, and the dollar index promptly climbed to a seven-week high as traders repriced how much further Chair Kevin Warsh's committee might go; sixteen of eighteen officials are on record expecting at least one more hike before year end. Higher rates raise the opportunity cost of holding a non-yielding asset, and that math doesn't care whether the asset sits inside an ETF or a cold wallet. A day earlier, the Senate fell one vote short, 49-50, of advancing the CLARITY Act, the bill that would hand digital-commodity oversight to the CFTC and give institutions the regulatory clarity many have said they're waiting for before committing bigger allocations. Two macro headwinds landed within 24 hours of each other; the ETF flows reacted immediately, while the spot price, so far, hasn't.
What to Watch Next
The next few sessions will say more than these two did. A third straight day of outflows would start to look like a trend rather than a blip, especially if it arrives alongside the price finally cracking the $75,000 level it's held through everything so far. Worth tracking too: whether the CLARITY Act's backers bring it back for another cloture vote, since a bill that fails by a single vote is delayed, not dead. And keep half an eye on how the Fed's guidance settles in elsewhere. If the dollar's post-hike strength keeps building, that pressure tends to eventually show up in every dollar-denominated asset, bitcoin included, even when the initial reaction looks this muted.
The Pulse24 Take
Neither number here tells the whole story by itself. $746 million in outflows sounds dramatic until you remember spot Bitcoin ETFs have taken in more than $54 billion since launch, and one rough week doesn't erase that math. A 1.5% price move sounds like calm until you remember it happened while institutional selling hit its sharpest two-day pace of the month. The more useful read is that the flow data and the price data are measuring different kinds of conviction right now, and they haven't agreed yet on which one is right. History suggests that when ETF outflows persist for more than a week or two, the price eventually notices. It hasn't so far. Whether that's because the selling is small relative to the market's size, or because whoever's absorbing it is simply patient, is the question worth answering before leaning too hard on either data point alone.
How we read the data
Curious how we get from raw data to a take like this? Our Trader's Toolkit walks through the tools we lean on.
Explore the Toolkit