Pulse24 Original
Bitcoin Spent 45 Weeks Below One Line on Its Chart. Then $2 Billion Showed Up in ETFs.
September 25, 2026
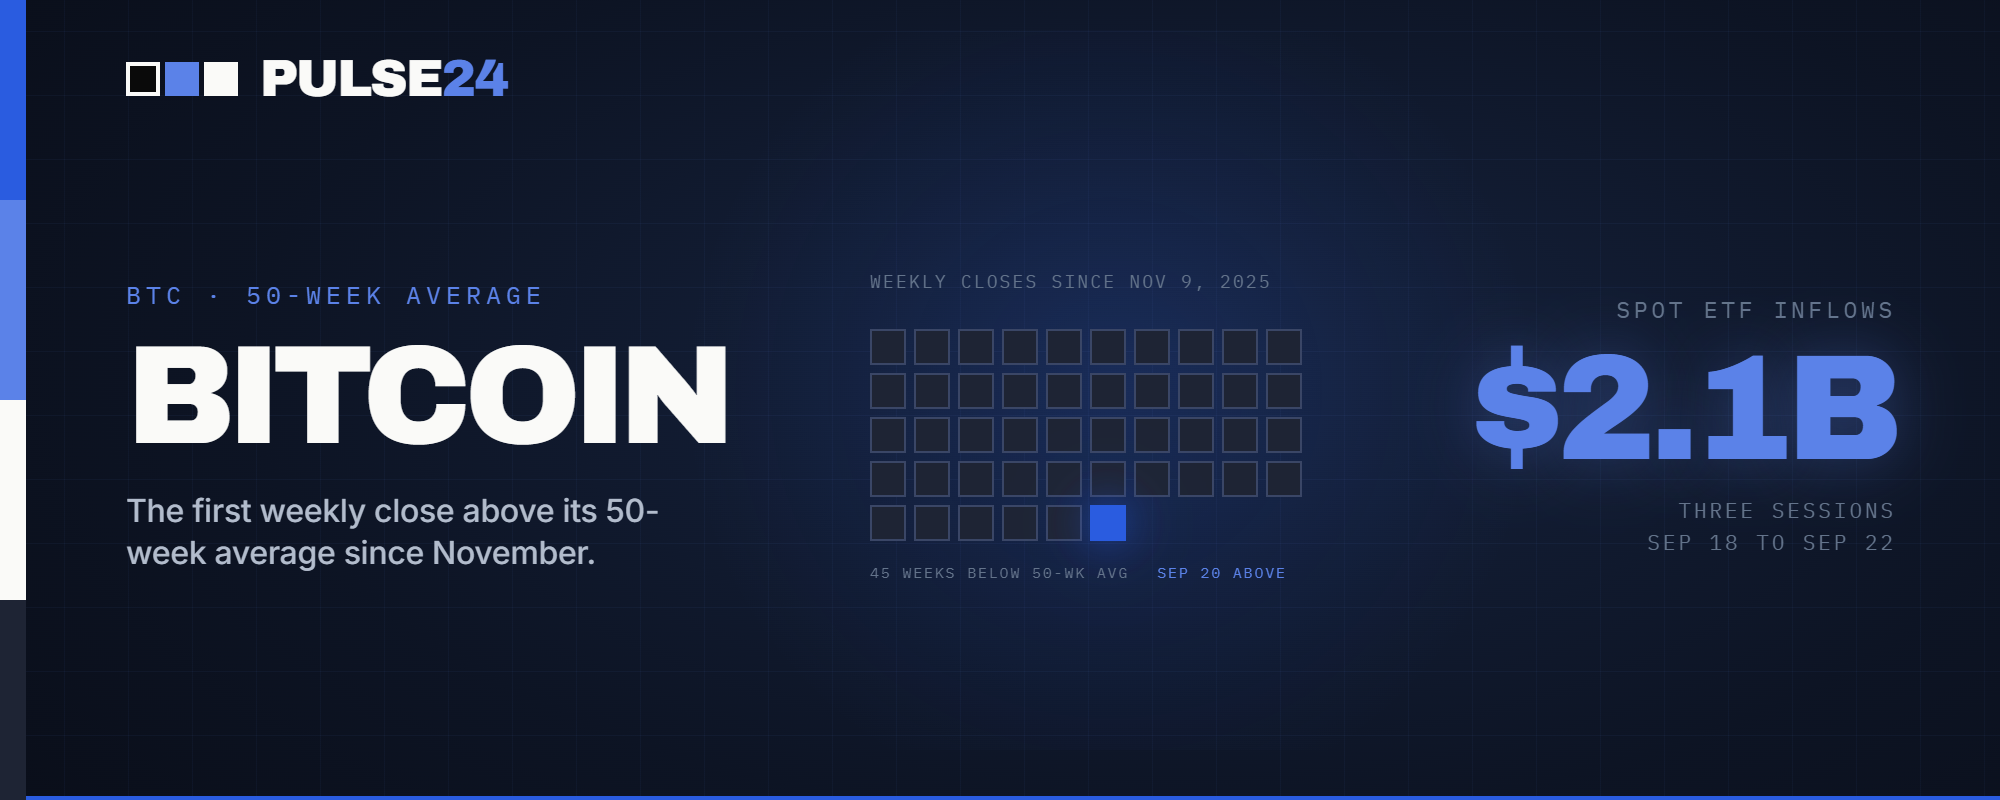
Bitcoin closed above its 50-week moving average for the first time since November, a level that's marked the end of four of its last five bear markets. Over $2 billion followed into spot ETFs within three trading sessions, a sharp reversal from the outflows the same funds saw just a week earlier.
Bitcoin's weekly candle closed at $81,159 on September 20, above its 50-week moving average for the first time in 45 weeks. The last close above that line came on November 9, 2025, right before the price began a long slide from above $126,000 toward the low $60,000s.
That streak matters more than it might sound. Galaxy Research has tracked bitcoin's relationship with its own 50-week average back to 2011 and found five prior reclaims of this level. In four of them, the price never printed a lower low afterward. Only the 2021 to 2022 cycle broke that pattern. Strategist Alex Thorn describes a fresh reclaim as strong confirmation that a bear market's lows are in, though he's careful to frame it as a historical tendency rather than a rule.
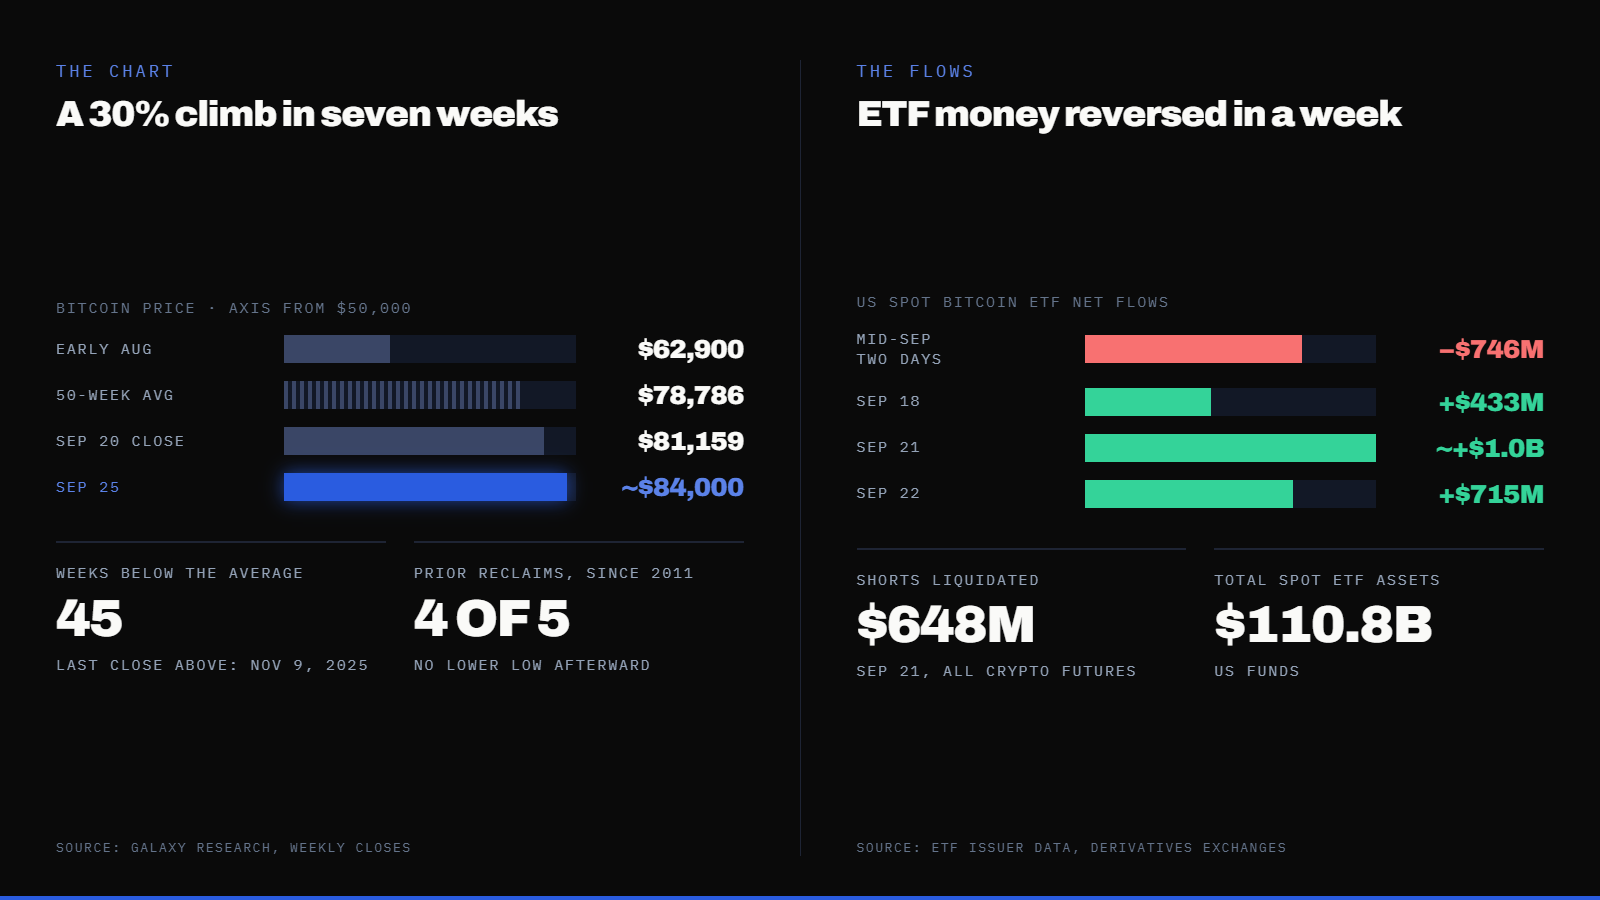
The climb that got bitcoin here started in mid-August. The month opened near $62,900 and closed near $78,850, a gain above 25% in four weeks. Bitcoin then spent most of September testing resistance around $82,000, a level that turned the price back four separate times since August 25 before it finally broke through. By September 25, spot prices were trading near $84,000, having briefly touched $85,000 two days earlier before the advance lost some steam.
Where the Money Came From
Price is one signal. Fund flows are another, and this time the two lined up. Spot Bitcoin ETFs had just come off a rough stretch: $746 million left the funds in a single two-day span in mid-September as investors digested the Fed's rate decision. That reversed fast. Creations came to $433 million on September 18, nearly $1 billion on September 21 alone (BlackRock's IBIT accounted for $381.4 million of that day, ARK's ARKB for $289.1 million, Fidelity's FBTC for $238.8 million), and another $714.74 million on September 22. Altogether, more than $2.1 billion moved into the products across those three sessions, on top of roughly $110.8 billion in total US spot bitcoin ETF assets.
The price action underneath those flows had its own force behind it. As bitcoin broke through the $84,000 to $85,000 zone on September 21, roughly $648 million in bearish futures bets were forced closed across crypto markets, with $218.55 million of that in bitcoin futures alone. Perpetual futures open interest climbed toward $160 billion over the same stretch. Traders who bet against the move were run over and had to buy back in to cover, a short squeeze that tends to speed up a rally without necessarily changing its direction.
Why It's Happening Now
None of this sits in a vacuum. Sixteen of eighteen Fed officials are on record expecting at least one more rate hike this year, and futures markets currently price October hike odds at around 66%, up sharply from the roughly 30% probability priced in right after this month's Fed meeting. Higher policy rates would normally work against a non-yielding asset like bitcoin. What's pulling in the other direction looks a lot like the story behind this year's gold rally too: sticky inflation, a dollar under pressure from fiscal concerns, and investors looking for something that isn't a government promise.
There's real competition for that capital, though. The 10-year Treasury yield has climbed to roughly 5.2%, close to its highest level in nearly two decades, and a risk-free rate that high raises the bar for every risk asset, bitcoin included. That's likely part of why the advance stalled just above $85,000 instead of pushing straight through it. Money chasing yield and money chasing a scarcity story are drawing from the same pool of capital, and this week neither side has clearly won.
What to Watch Next
The next weekly close will say more than any single day's move. A second consecutive close above the 50-week average, which sits near $78,786 and drifts higher slowly each week, would add weight to the case that this is a genuine trend shift rather than a squeeze-driven spike. ETF flow data deserves attention too: a run of steady daily creations would suggest allocators are building positions, not just covering trades. And the 10-year yield is worth tracking on its own. If it keeps climbing toward 5.5%, the competition for capital only gets tougher, regardless of how constructive bitcoin's chart looks.
The Pulse24 Take
A 45-week losing streak against your own moving average ending sounds like chart trivia until you notice how often it's marked a real turn before. Four times out of five isn't a guarantee, and the one exception, in 2021 heading into 2022, is a reminder that patterns tend to break exactly when everyone trusts them most. What makes this reclaim worth more attention than the price move alone is that real money showed up behind it: over $2 billion in ETF creations across three sessions, not just short covering. Short squeezes fade once the shorts are gone. Sustained ETF demand doesn't need one to keep going. The next two or three weekly closes should make clear which of those is actually driving this rally.
How we read the data
Curious how we get from raw data to a take like this? Our Trader's Toolkit walks through the tools we lean on.
Explore the Toolkit