Pulse24 Original
Bitcoin Broke Below Its 50-Day Average for the First Time Since August. Its ETFs Logged Their Worst Outflow Since June a Day Earlier.
October 24, 2026
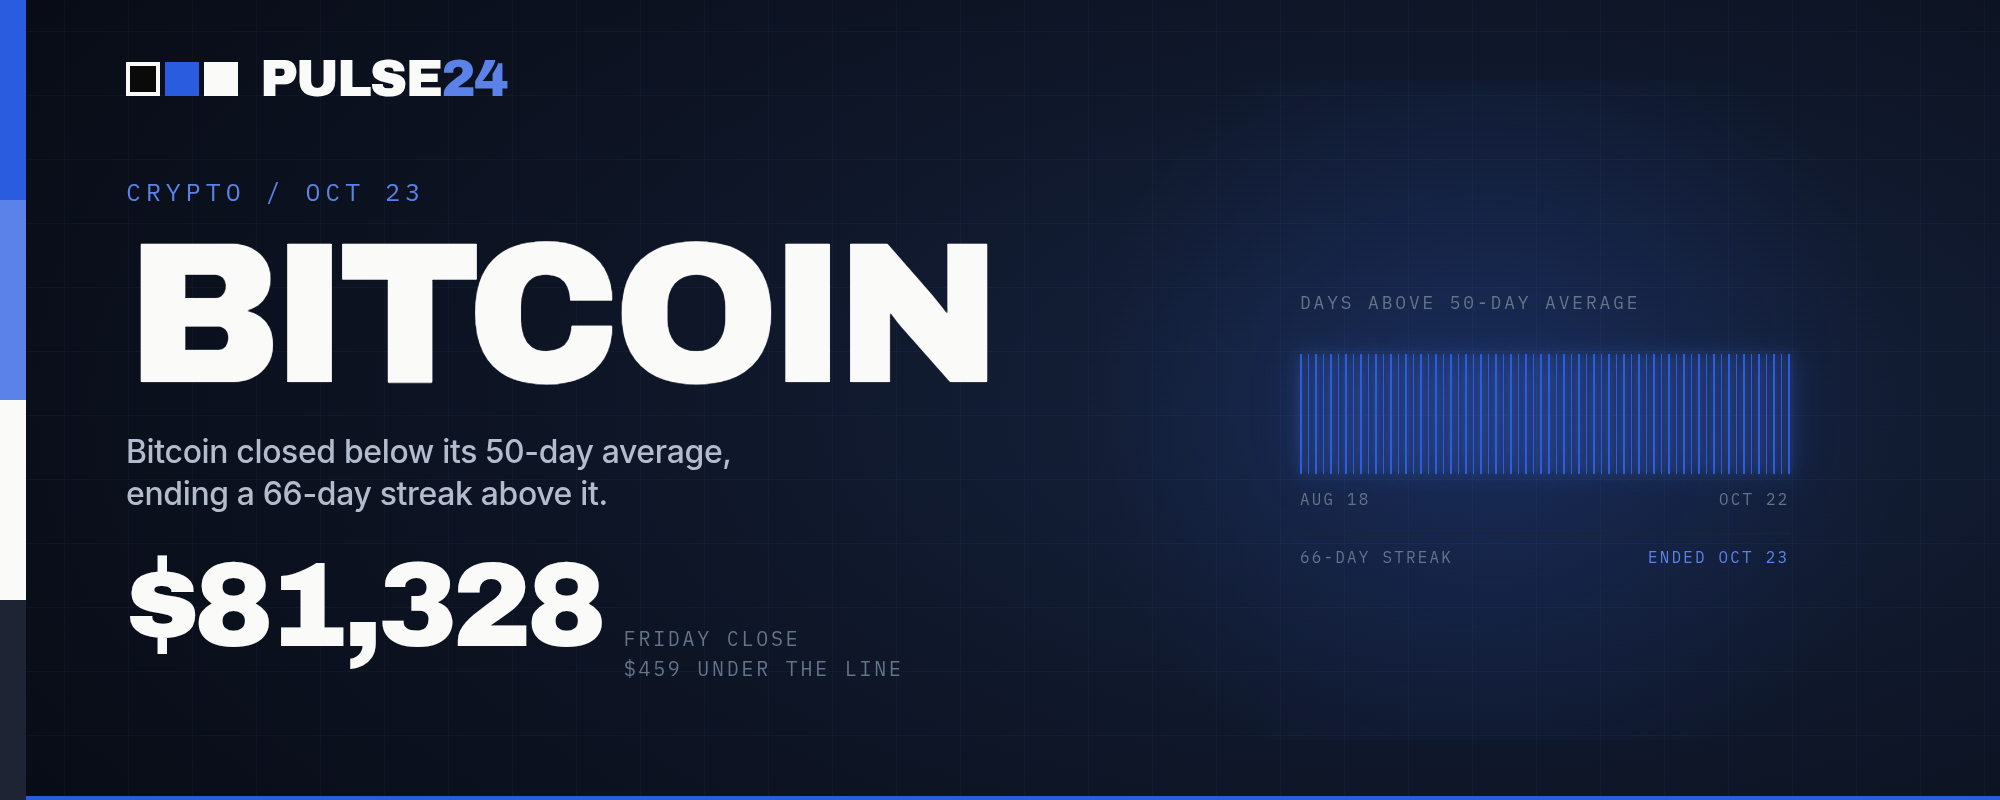
Bitcoin's close below its 50-day moving average ended a 66-day streak, a day after spot ETFs logged their biggest single-day outflow since June. Both trace back to Thursday's broader tech selloff, triggered by AI-spending jitters after Meta and Tesla's earnings.
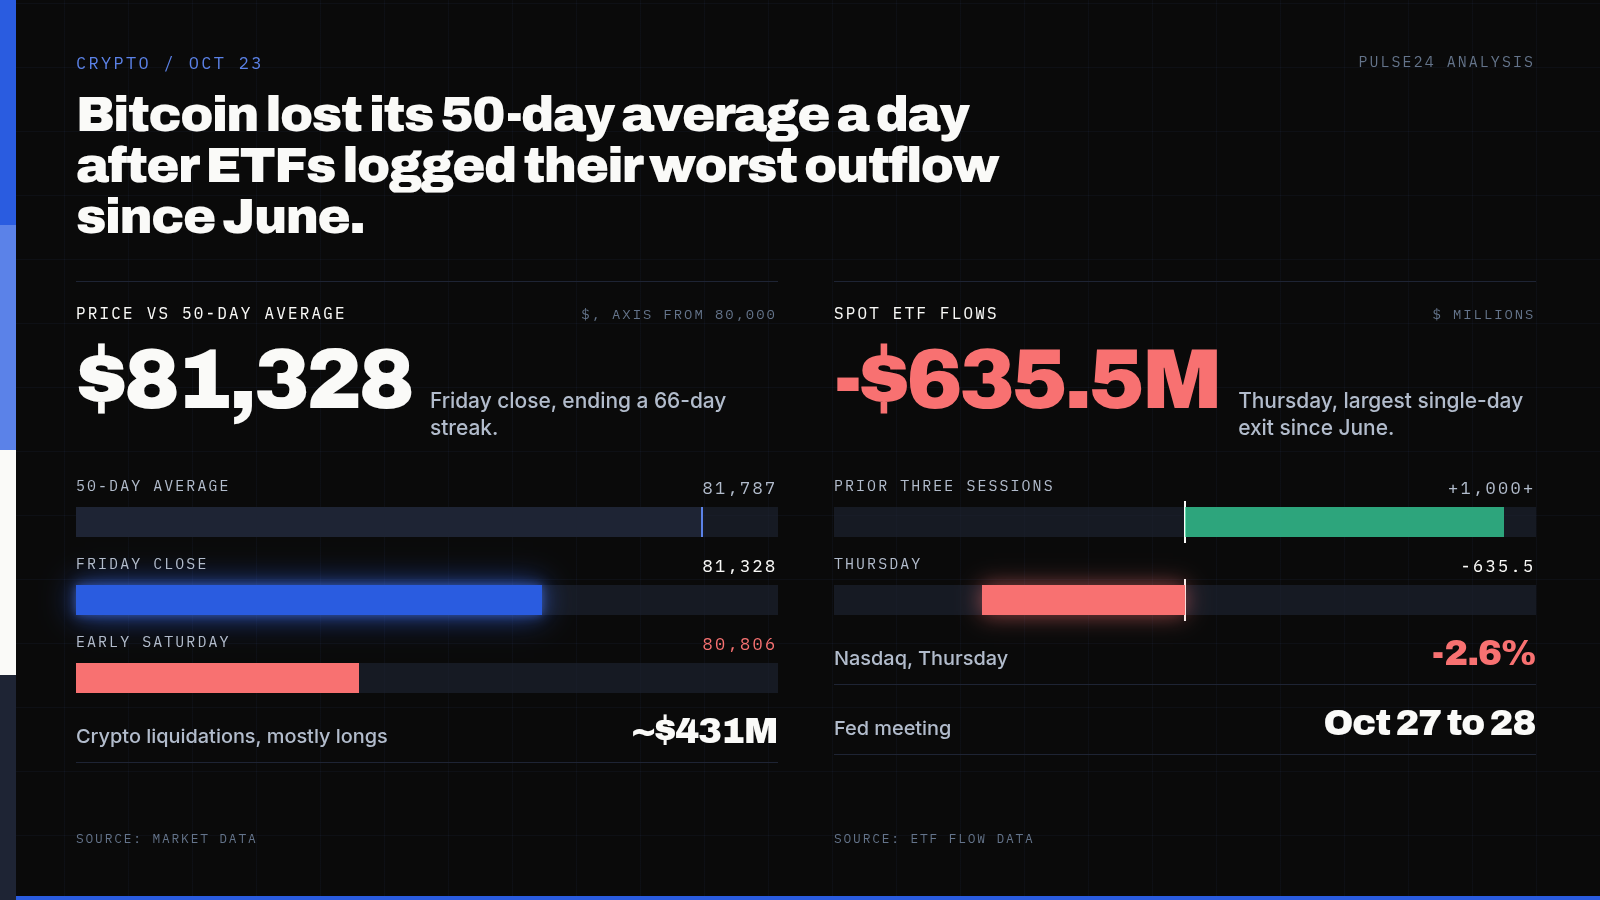
Bitcoin closed at $81,328 on Friday. Nothing about that number looks dramatic on its own, somewhere between a bad week and a normal one for an asset that has moved more than $20,000 in the past three months. What makes it notable is what it broke. For 66 straight trading days, from August 18 through October 22, bitcoin's close had stayed above its 50-day moving average. Friday's close fell $459 short of it.
The moving average itself is just an average of the last 50 closes, nothing more mystical than that. But a lot of trading software treats a cross below it as a sell signal, and when enough of that software fires at once, the signal becomes partly self fulfilling. That is the mechanical risk in a break like this one. It says less about bitcoin's underlying value than about who might be selling in the next few sessions.
The approach to this line took weeks, not days. On October 5, bitcoin peaked at $86,490, which put it $7,465 above its 50-day average. That gap narrowed to just $83 by October 18, as the rising average caught up with a cooling price. Five days later, the lines crossed.
What Pushed It Below the Line
Thursday supplied the push. The Nasdaq closed down 2.6% that day, with futures sliding another 1.1% overnight, after Meta posted its first negative free cash flow quarter in a decade and Tesla's own earnings reopened the debate over what the AI buildout actually costs. Tesla's 2026 spending came in lighter than expected, but investors focused instead on heavier spending plans for 2027 and 2028 tied to robotics and AI infrastructure. Chip and data center names took the sharpest hits, with Lam Research down about 9% and CoreWeave off 10% on renewed worries about the cost of financing AI buildouts. That reaction rippled into crypto within hours. About $431 million in positions were liquidated over 24 hours, according to CoinGlass, with longs making up almost all of it.
The same day, bitcoin's spot ETFs reversed hard. The funds had pulled in more than $1 billion over the prior three trading days, including the rally that took bitcoin briefly above $84,800 on Wednesday. On Thursday, they gave back $635.5 million in a single session, the largest one-day outflow since June. BlackRock's IBIT led the exit at about $254 million, with Fidelity's FBTC close behind at roughly $217 million.
A Quiet Market Woke Up
This break did not come out of nowhere. Bitcoin had spent weeks in an unusually tight range, a Bollinger Band squeeze that technicians flagged as the kind of calm that typically precedes a bigger move in one direction or the other. That move arrived this week, though not in the direction the squeeze itself predicted.
By Saturday morning, bitcoin was trading near $80,806, a full $1,001 below its 50-day average of $81,807. Other averages tell a steadier story. The price sits 7.3% above its 100-day average and nearly 11% above its 200-day average, and both of those lines keep climbing. Short-term indicators look weaker. Bitcoin trades 2.1% below its 20-day average, the more sensitive line that tends to move first.
What to Watch Next
The next scheduled catalyst is the Federal Reserve's meeting on October 27 and 28. Odds for the October decision have leaned toward a hold for weeks, with most of the hiking debate pushed into December, and a hawkish surprise from the Fed would land on a crypto market that already has fewer buyers showing up than it did a week ago. Mining difficulty is also due to rise again on October 29, by an estimated 5.6%, a reminder that the network's cost structure keeps tightening regardless of where the price sits.
None of this settles whether Friday's close was a turning point or a pause. A 50-day average crossing below price is a trading signal, not a verdict, and moving-average breaks like this one do not always mark a top. What is different this time is the company it is keeping. An ETF outflow, a leveraged long wipeout, and an equity selloff all landed in the same 48 hours.
The Pulse24 Take
Price technicals get treated like oracles more often than they deserve. A 50-day moving average is a backward looking number built from 50 closes, and crossing it does not change bitcoin's supply or its correlation to the Nasdaq. What it does change is who is watching the next few sessions more closely, because enough trading systems use that line as a trigger that the break can briefly become its own small weather system.
The more informative number this week was not the moving average at all. It was the $635.5 million that left bitcoin ETFs on Thursday, right after $1 billion had come in over the three sessions before it. That kind of swing reads as institutional money still trading bitcoin as a risk asset tied to the Nasdaq's mood, rather than the inflation hedge it is sometimes pitched as. Until that correlation breaks, every AI spending headline is a bitcoin headline too.
How we read the data
Curious how we get from raw data to a take like this? Our Trader's Toolkit walks through the tools we lean on.
Explore the Toolkit