Pulse24 Original
Bitcoin's Price Chart Hasn't Been This Quiet in Two and a Half Years. History Says That Never Lasts Long.
October 19, 2026
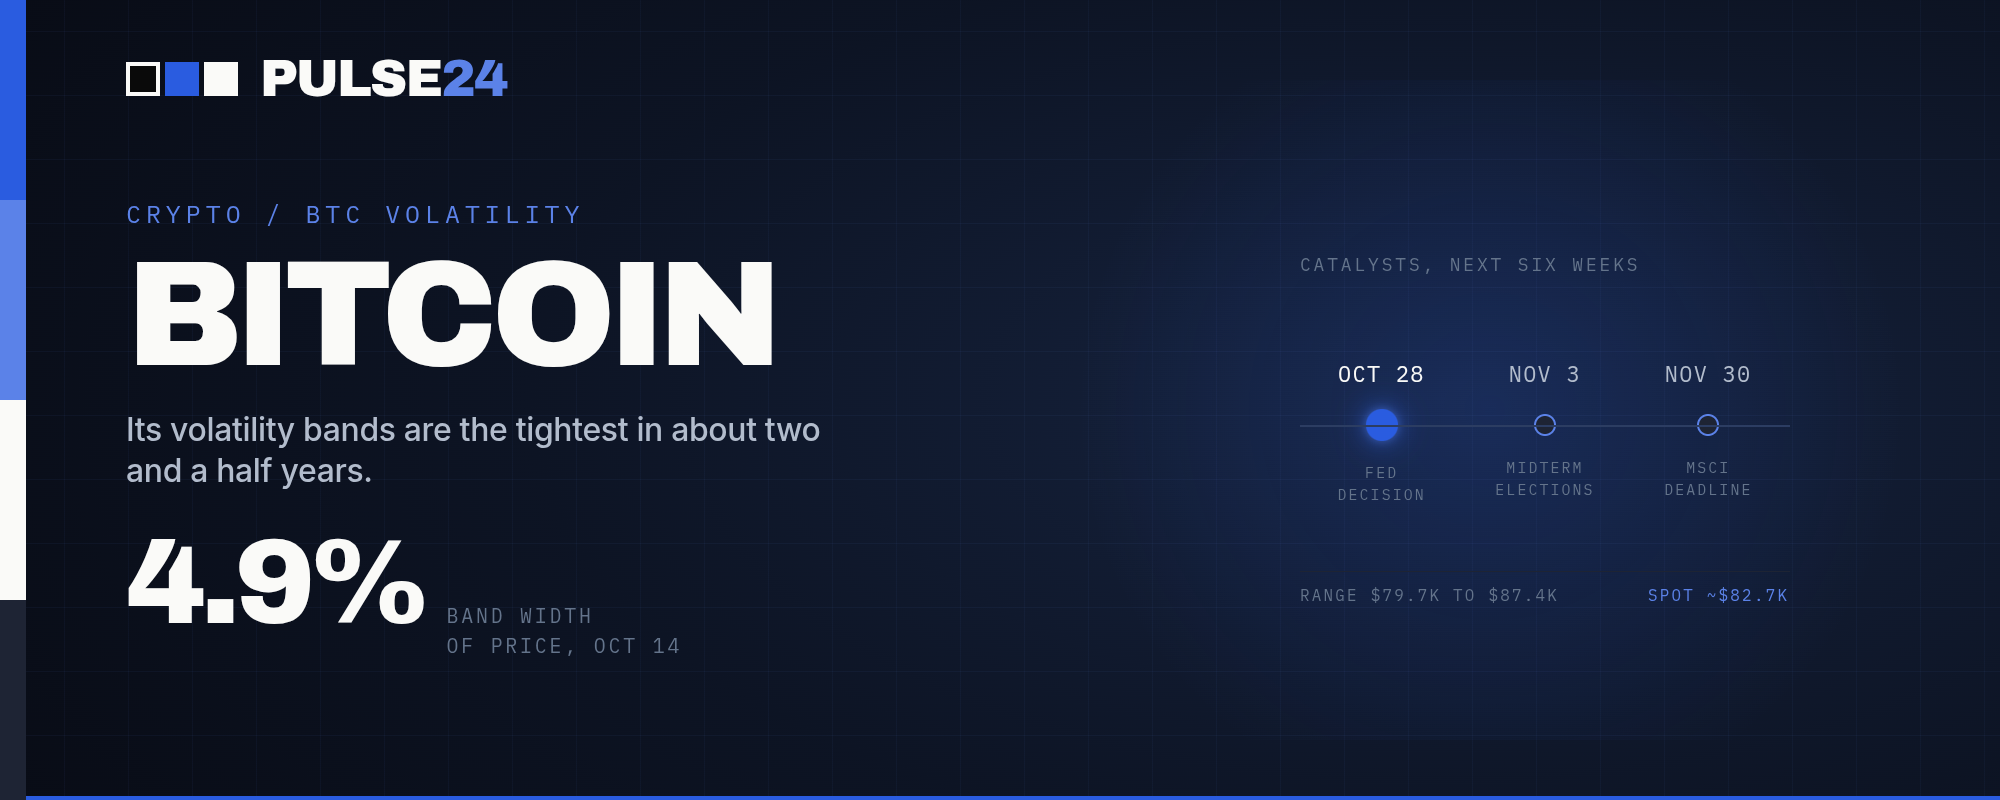
Bitcoin's Bollinger Bands have compressed to their tightest reading in roughly two and a half years, a setup that has historically preceded a sharp move in either direction. With the Fed's October 28 decision and a pile of ETF, election, and index-rule catalysts stacked up right after, traders are running out of time to guess which way this one breaks.
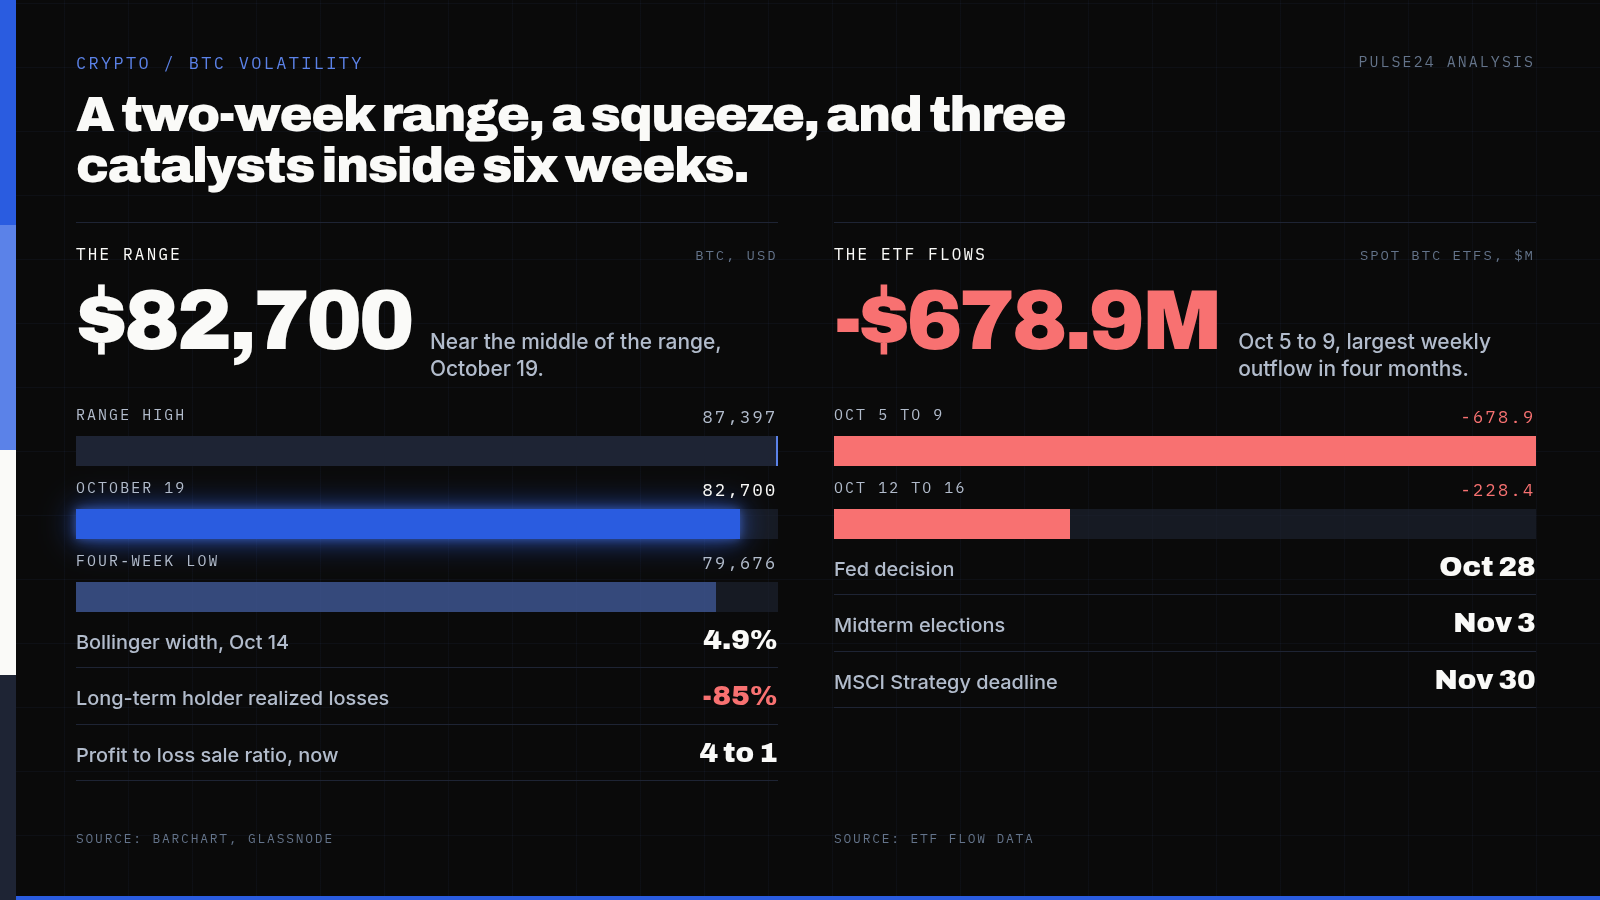
Bitcoin traded near $82,700 on Monday morning, up about 1% on the day and sitting almost exactly in the middle of the range it has held for the past two weeks. That stillness is the real story. The gap between Bitcoin's 20-day Bollinger Bands, the standard volatility envelope built two standard deviations around a moving average, narrowed to 4.9% of the average price on October 14, the tightest reading since mid-September. By October 19, Barchart was calling it one of the narrowest readings in roughly two and a half years.
A Bollinger Band squeeze does not predict direction. It predicts that a quiet market usually doesn't stay quiet for long. John Bollinger built the bands in the early 1980s to flag exactly this condition: volatility compressed enough that a sharp move, in either direction, becomes more likely than a continuation of the current grind. Bitcoin has seen this setup before in the current cycle. A similar compression in August resolved upward, with price holding above $80,000 in the weeks that followed. Earlier instances this year resolved lower.
What Changed
The price action underneath the quiet surface tells a split story. Bitcoin touched a four-week low of $79,676 last week before buyers stepped back in near the $80,000 to $81,500 zone that Glassnode flags as the average cost basis for spot Bitcoin ETF holders. On the other side, the asset topped out near $87,397 in an early-October test and has struggled to clear $86,000 since. Daily RSI sits at 51.35, essentially neutral, while the MACD still carries a bearish tilt. Neither indicator makes a strong case for either side, which is exactly the kind of indecision that produces a tight band in the first place.
ETF flows have mirrored the hesitation. The week of October 5 to 9 brought $678.9 million in net outflows, the largest weekly pull in close to four months, with BlackRock's IBIT losing $207.7 million in a single Wednesday session before partially recovering two days later. Flows then calmed down: the week of October 12 to 16 saw a smaller $228.4 million in net outflows, with IBIT accounting for $165.4 million of it and Fidelity's FBTC losing $60.2 million. Total net assets across U.S. spot Bitcoin ETFs stood near $104.3 billion as of October 16, according to SoSoValue.
Why It Matters
A tight range this far into a volatile year tends to resolve with force rather than drift. Short sellers already learned that lesson once this cycle, losing nearly $40 million defending Bitcoin's $83,000 floor when buyers showed up harder than the options market had priced in. The current setup carries the same mechanical risk on both sides. Thin volume and compressed volatility mean that whichever side gets proven wrong first may have to cover quickly, adding fuel to whatever move starts.
The on-chain backdrop adds a layer most headlines miss. Holders who bought Bitcoin six to twelve months ago carry an average cost basis near $88,000, meaning a meaningful share of recent buyers are still underwater at current prices. That group tends to sell into any rally that gets them back toward breakeven, which helps explain why $86,000 to $88,000 has acted as a lid. Long-term holder realized losses, meanwhile, have dropped 85% since their August 12 peak, and the ratio of profit-taking to loss-selling has swung from about 12-to-1 against profit at June's low to roughly 4-to-1 in its favor now. Fewer coins are changing hands at a loss, usually a sign that the weakest-handed selling has largely run its course.
What to Watch Next
The calendar does not leave this squeeze much room to sit quietly for long. The Fed's rate decision lands October 28, and odds on an October hike have already swung sharply in the run-up, the kind of macro surprise that tends to move every risk asset at once. Five days later, the November 3 midterm elections arrive, and Bitcoin's record there cuts in two directions depending on the time frame. In 2018, Bitcoin fell roughly 45% in the month after the vote before finishing the following 12 months up 44.9%. The 2014 and 2022 midterms were followed, per CryptoQuant data, by 12-month gains of 24.5% (2014) and 92.3% (2022).
Layer on top of that a November 30 deadline tied to whether Strategy stays in a key MSCI index, which could force passive funds to sell shares of one of the largest corporate holders of Bitcoin regardless of what the spot price is doing that week. A close above $84,000 to $85,000 would put the $86,000 to $87,397 zone back in play, while slipping below $81,900 would reopen the path toward last week's $79,676 low. Either way, the next two to three weeks look like the window where this particular squeeze gets its answer.
The Pulse24 Take
Compressed volatility is one of the few technical signals that is honest about its own limits. It says a move is coming without pretending to know which way, and anyone who tells you otherwise is reading a chart pattern as though it were a crystal ball. What makes this squeeze worth watching is how many real catalysts land right behind it in the next six weeks: a Fed decision on October 28, an election on November 3, and an index deadline on November 30 that could force selling independent of sentiment.
The on-chain data leans slightly constructive. Long-term holders aren't dumping into weakness the way they were in June, and the ETF outflows of the past two weeks look more like profit-taking after a strong run than a wholesale retreat. None of that guarantees an upside resolution. It does suggest the sellers who remain are running lower on conviction than the buyers defending $80,000, and compressed ranges eventually break toward whichever side is less tired.
How we read the data
Curious how we get from raw data to a take like this? Our Trader's Toolkit walks through the tools we lean on.
Explore the Toolkit