Pulse24 Original
Gold Set a New High This Week. Silver Is Still 45% Below Its Own Record.
September 19, 2026
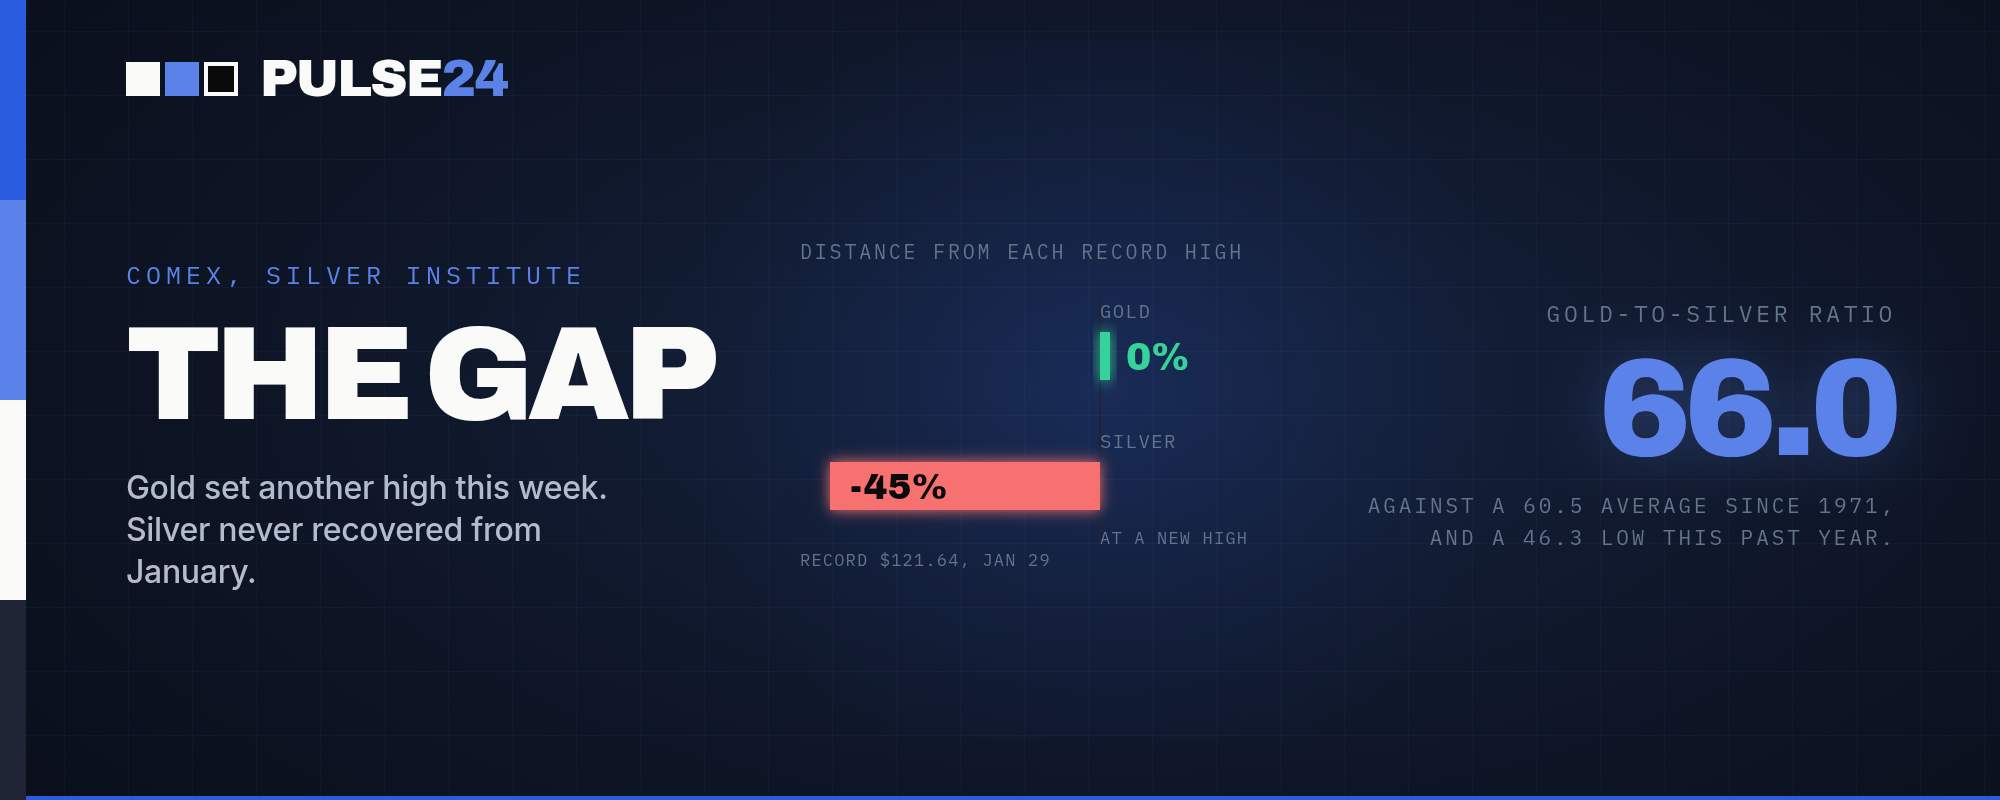
Gold notched a fresh weekly high on Friday, but silver is still trading roughly 45% below the record it set in January before a historic one-day crash. The gap between the two metals, now near its widest point in years, may say more about what happens next than either price alone.
Silver closed out the week near $66 an ounce, up 3.9% from Monday and its best five-day stretch in over a month. On its own, that reads like a comeback. Stack it against the metal's own record and the picture changes: silver traded above $121 an ounce as recently as January 29, and Friday's bounce still leaves it roughly 45% below that high.
What Changed
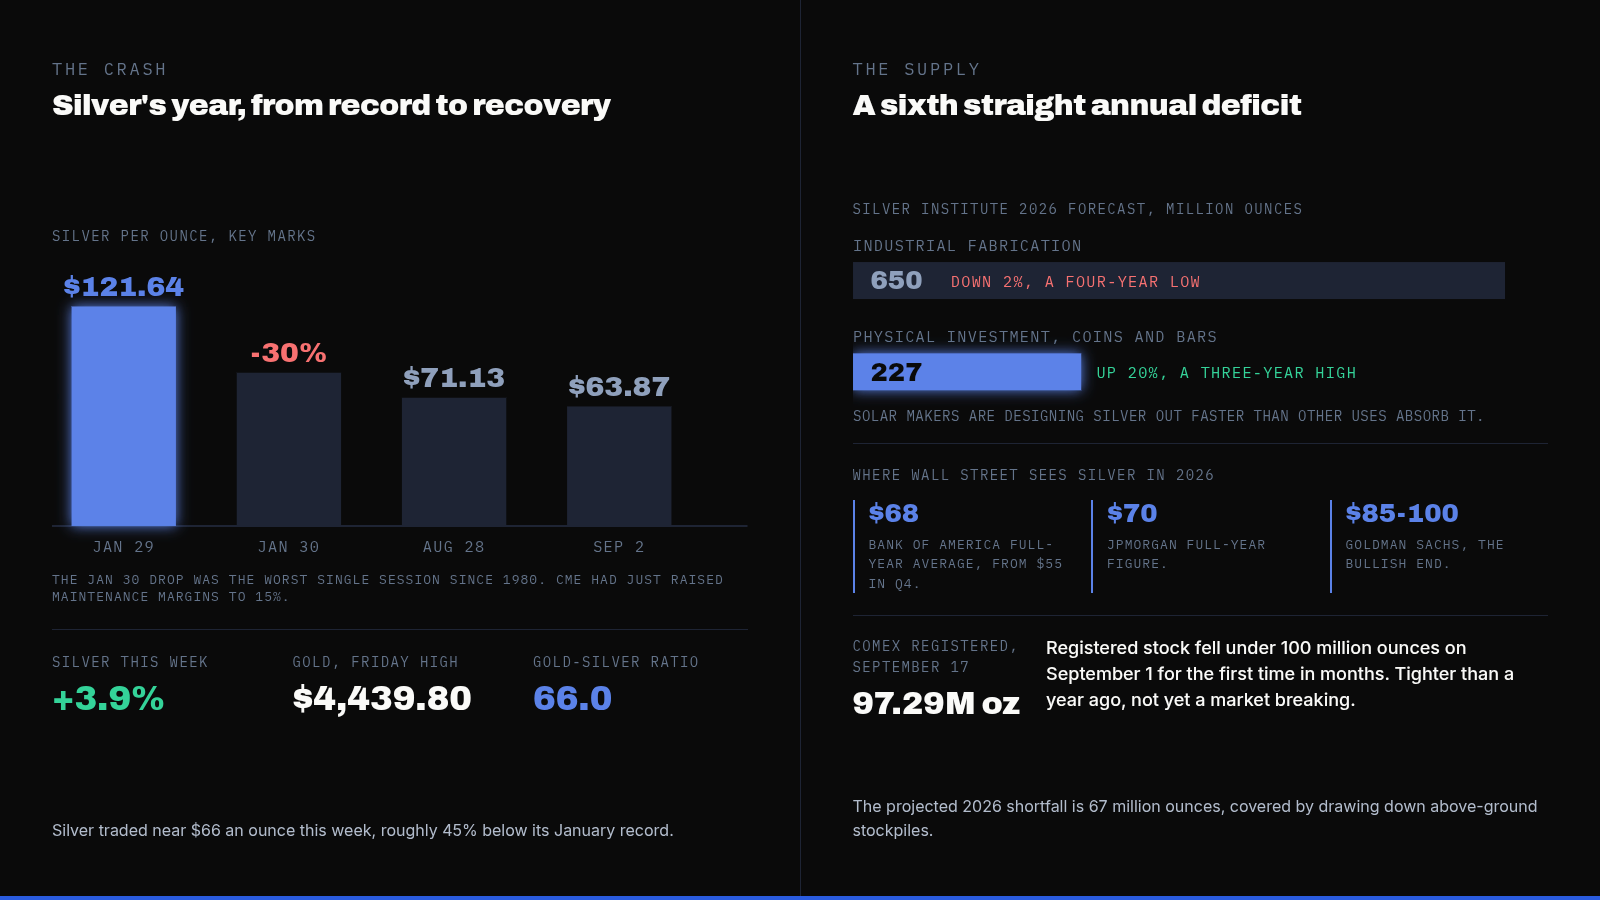
The gap traces back to one of the more violent moves in the metal's history. Silver hit an all-time high of $121.64 on January 29, then dropped 30% the very next day, the worst single-session loss since 1980. Fed chair nominee Kevin Warsh's selection eased investor worries about political interference at the central bank that same week, cutting into the safe-haven demand that had helped drive silver's run. CME Group had also raised maintenance margins on silver futures to 15% just as the rally was peaking, and once the reversal started, leveraged funds got pushed out of their positions fast.
Warsh went on to become Fed chair, and his first rate hike as chair, delivered on September 17, briefly pushed the dollar index above 100 for the first time in seven weeks. Silver spent the months after that crash well below its January peak, at one point cooling into the $60s, before finding a stronger bid in August. It rose as much as 21% month-over-month that month, touching $71.13 on August 28, then slipped to a September low of $63.87 on September 2. It has traded mostly in the mid-$60s since, including this week's 3.9% gain, in what has been an unusually choppy year even by silver's own standards.
Why It Matters
Gold has had an easier time of it. It touched a fresh weekly high of $4,439.80 an ounce on Friday, clearing $4,400 for the first time in about two weeks. Silver's slower recovery shows up directly in the ratio between the two metals: gold divided by silver stood at 66.0 as of Saturday, above the 60.5 average the ratio has held since 1971 and well above the 46.3 low it touched over the past year.
A ratio this wide usually gets read one of two ways. Either silver is unusually cheap relative to gold and has room to catch up, or the market has legitimate reasons to value it differently than it did a decade ago. The Silver Institute's 2026 outlook leans toward the first explanation. It projects a sixth consecutive annual supply deficit, 67 million ounces this time, with the market continuing to draw down above-ground stockpiles to cover the shortfall. Physical investment demand, coins and bars mostly, is forecast to rise 20% to a three-year high of 227 million ounces. Industrial fabrication points the other way: the Institute expects it to fall 2% to roughly 650 million ounces, a four-year low, as solar manufacturers substitute away from silver in photovoltaic cells faster than data centers and automotive electronics can pick up the slack.
Exchange inventories haven't caught up with the deficit story yet. Registered silver on COMEX dropped below 100 million ounces on September 1 for the first time in months and stood at 97.29 million ounces on September 17, a level that sits comfortably within its own 30-day range. That's a tighter market than it was a year ago. It isn't yet a market showing signs of breaking.
What to Watch Next
Wall Street's own forecasts for silver are unusually spread out. Bank of America's estimate ranges from $55 in the fourth quarter to a full-year average near $68. JPMorgan puts its full-year figure near $70. Goldman Sachs has floated $85 to $100 on the bullish end. A spread that wide between the low and high case suggests professional forecasters don't share much conviction about which way this settles.
The gold-silver ratio is the cleaner thing to watch: a move back toward 60 would mean silver is closing the gap with gold's strength, while a push toward 70 or beyond would say the market still trusts gold's demand story more than silver's. COMEX registered inventory is worth tracking too. Another leg down from September's low, especially if it breaks meaningfully under 95 million ounces, would be the first real sign that the supply deficit is starting to show up in the numbers that trade day to day, rather than just in an annual forecast.
The Pulse24 Take
Silver's chart tells a dramatic story regardless of how it's read: a run to $121, then a 30% collapse in a single session. Eight months later, it has recovered less than half the ground it lost. The quieter number might matter more. A gold-silver ratio above 66 says the market is still treating silver more cautiously than gold, even though silver's supply picture, a sixth straight annual deficit and a jump in bar-and-coin demand, arguably looks more constructive right now than gold's. That gap can persist for a long stretch. A ratio above 60 has shown up in 29 of the last 55 years. It can also close quickly, the way it did in 1980, when the ratio fell to 17 to 1 during the Hunt brothers' attempt to corner the silver market, a year that also produced the single-day drop record broken only this past January. Nothing in this week's data says which way the current gap resolves. It does say gold and silver are no longer telling the same story, and that divergence is worth watching more closely than either metal's price by itself.
How we read the data
Curious how we get from raw data to a take like this? Our Trader's Toolkit walks through the tools we lean on.
Explore the Toolkit