Pulse24 Original
Stablecoins Just Shrank $7.7 Billion in a Month. They Also Just Set an All-Time Volume Record.
July 28, 2026
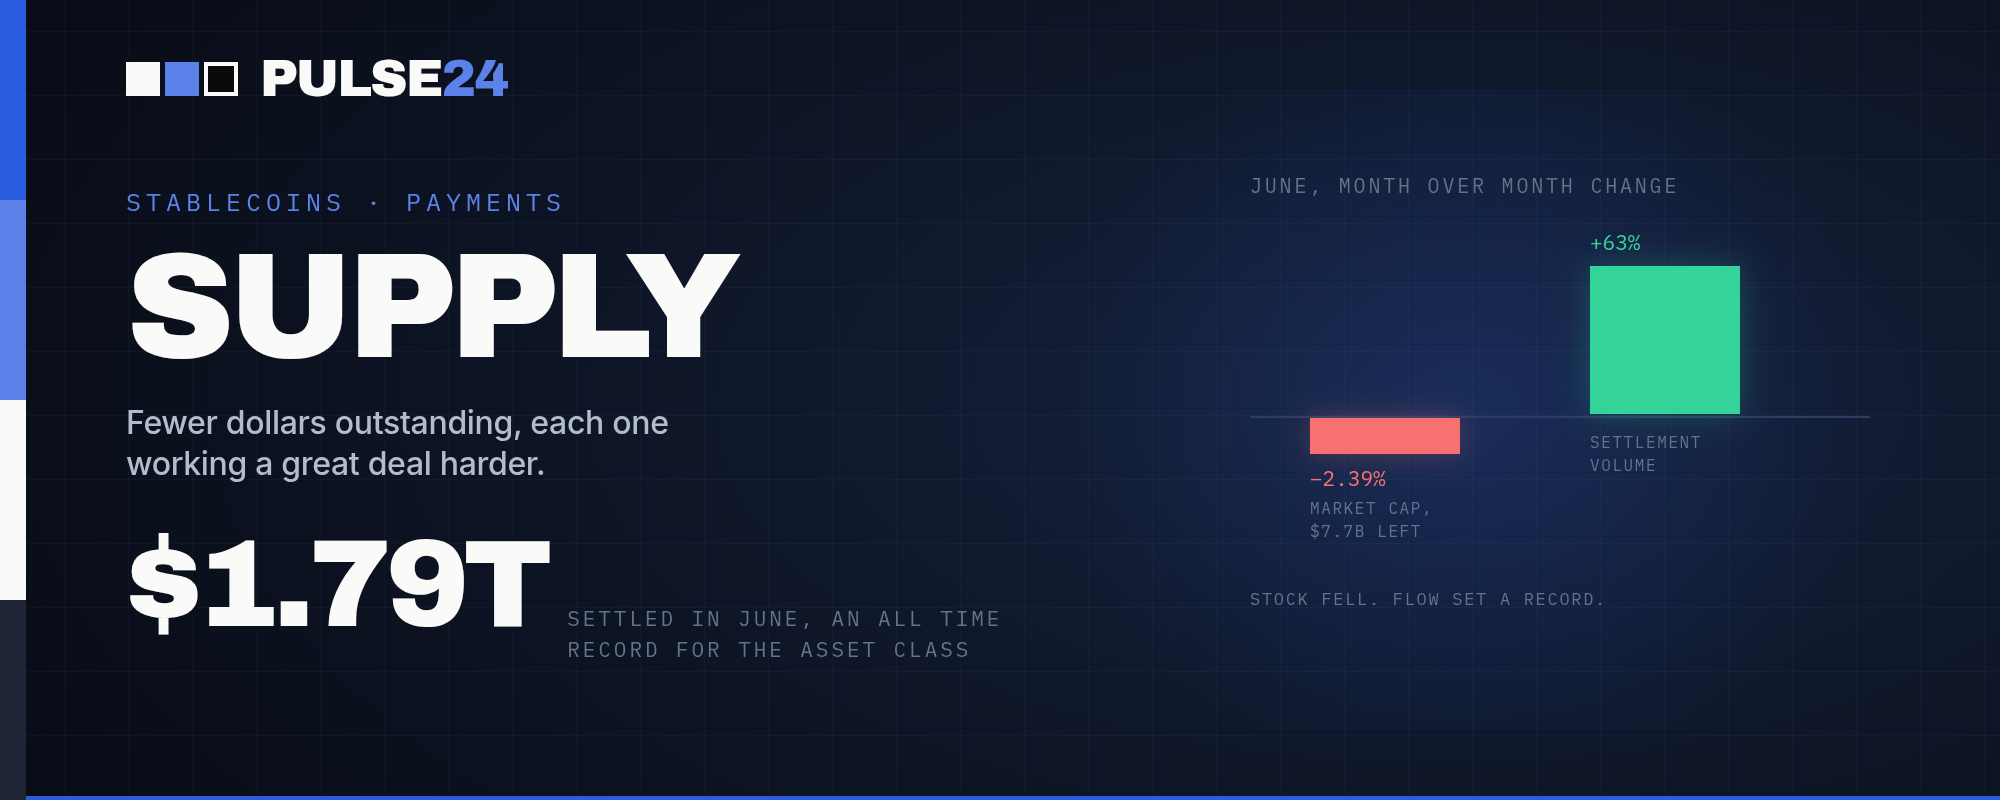
Stablecoins shrank for the first time in four years, dropping $7.7 billion in June to about $312 billion, the steepest monthly decline since Terra's 2022 collapse. But settlement volume hit an all-time record of $1.79 trillion the same month, up 63%, a signal that stablecoins are moving from parked collateral into an actual payments rail.
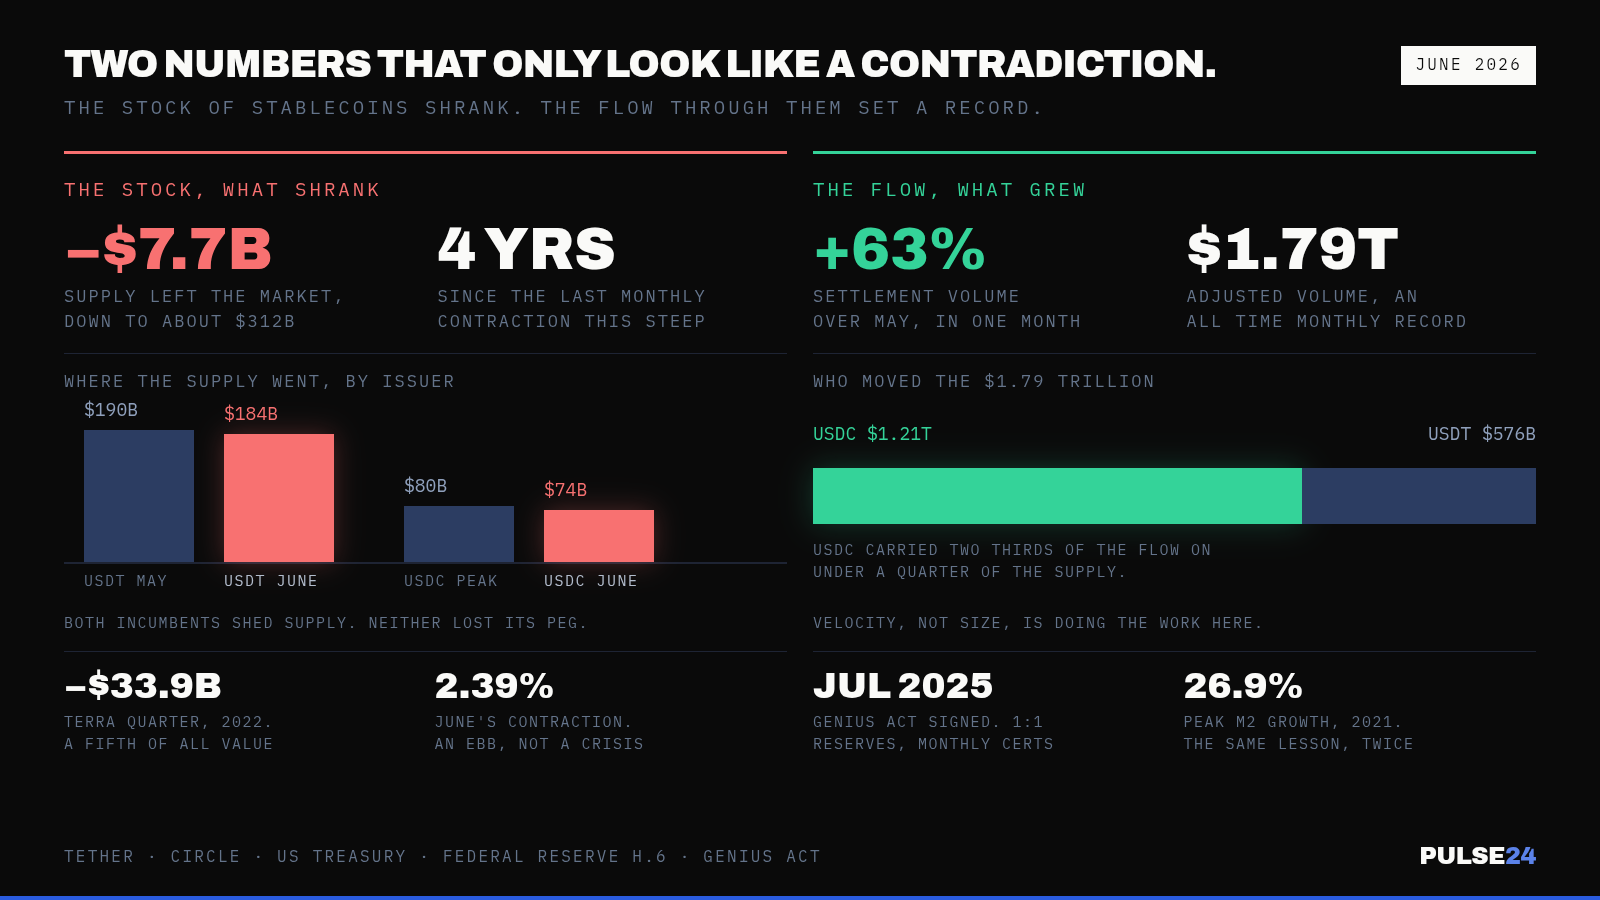
Stablecoins just did something they haven't done in four years: their combined market cap shrank. Total supply fell $7.7 billion in June to about $312 billion, a 2.39% monthly contraction and the steepest single-month dollar decline since Terra-Luna's collapse wiped out stablecoin value in May 2022. Tether's USDT slid from roughly $190 billion in May to about $184 billion. Circle's USDC fell from a March peak near $80 billion to around $74 billion.
What Changed
The comparison to 2022 is right there in the numbers, and it is worth taking seriously enough to check. During Terra's collapse, leading stablecoins lost $33.9 billion, almost a fifth of their combined value, in a single quarter, and the crisis was defined by a market-wide depeg that broke the core promise of the entire asset class. Nothing like that happened this time. USDT and USDC both held their pegs through June without incident. A 2.39% pullback in a month is a normal ebb for an asset class this size, not a crisis.
What makes June unusual is what happened at the same time. Stablecoins settled $1.79 trillion in adjusted transaction volume that month, an all-time record and a 63% jump from May. USDC alone processed about $1.21 trillion of that. USDT handled roughly $576 billion. Supply went down. Throughput went up, sharply, in the same 30 days. That's a different metric than the exchange-bound stablecoin transfers that track short-term buying pressure, the kind of flow data that helped explain Bitcoin's slide below $64,000 in late July, and conflating the two is another way this story gets misread.
Why It Matters
Market cap and settlement volume measure two different things, and conflating them is where the stablecoins-are-shrinking headlines go wrong. Market cap is a stock measurement, a snapshot of how many stablecoins currently exist. Settlement volume is a flow measurement, how many times those stablecoins actually changed hands doing real work. A monetary instrument can lose supply and still be getting healthier, if the reason supply is leaving is that idle balances are being spent instead of parked. June's data reads like exactly that: fewer stablecoins outstanding, each one working harder.
The timing is not a coincidence either. This data lands almost exactly one year after the GENIUS Act, the first federal framework for US stablecoins, was signed into law on July 18, 2025. It requires issuers to hold full one-to-one reserves in cash or short-term Treasuries, bans rehypothecating those reserves, mandates monthly certifications, and opens issuance to bank subsidiaries and OCC-supervised nonbanks under real prudential oversight, while walling off big tech and other non-financial firms from issuing their own without a rare unanimous exemption. None of that rewards a stablecoin for sitting idle in a wallet. It rewards one for being redeemable, audited, and in motion. A regulatory regime built around reserves and redemption, with banks now entering the market under that same framework, is exactly the environment where you would expect supply to lean out while usage leans in.
What to Watch Next
The open question is whether June's volume was a structural shift or a one-off. Quarter-end settlement cycles and cross-border remittance flows can produce a temporary spike in turnover that fades the next month. Watch whether July and August volume holds anywhere near $1.79 trillion, or reverts toward the prior run rate. Watch Tether's and Circle's reserve disclosures as bank-issued, GENIUS-compliant stablecoins from newly entering institutions start pulling share, since a genuine structural shift should show up as volume concentrating in fewer, harder-working dollars rather than supply simply moving between the two incumbents.
Also worth tracking is how the next supply contraction gets covered, because there will be one. If it gets reported as a standalone alarm without a look at volume alongside it, that is a sign this month's lesson did not stick.
The Pulse24 Take
This is not a new mistake, and it is not unique to crypto. The US saw a similar disconnect with M2 money supply from 2020 to 2023. M2 grew at a 26.9% year-over-year rate in February 2021, the fastest expansion on record, then reversed into an outright year-over-year decline in late 2022, the first such decline since at least 1959. Commentators spent that entire window treating the stock of money as the whole story, first as proof inflation was inevitable, then as proof a crash was coming. What mattered more was how that money moved. During the 2008-to-2015 quantitative easing era, the monetary base expanded enormously without producing comparable M2 growth or inflation, largely because banks parked the new reserves at the Fed instead of lending them out. Same stock-side event, opposite outcome, because velocity told the real story both times.
Stablecoins are young enough that most people watching them have not internalized this distinction yet, which is exactly why June is worth remembering past this news cycle. Whether stablecoins sit at $312 billion or $900 billion three years from now, the discipline is the same: before reacting to a supply number in either direction, check what the money is actually doing. A shrinking stock moving faster can be healthier than a growing stock sitting still, and that filter does not expire when this month's numbers do.
How we read the data
Curious how we get from raw data to a take like this? Our Trader's Toolkit walks through the tools we lean on.
Explore the Toolkit