Pulse24 Original
Bitcoin Broke $64,000. A 4.31% Treasury Yield Explains Why Cooling Inflation Couldn't Save It.
July 26, 2026
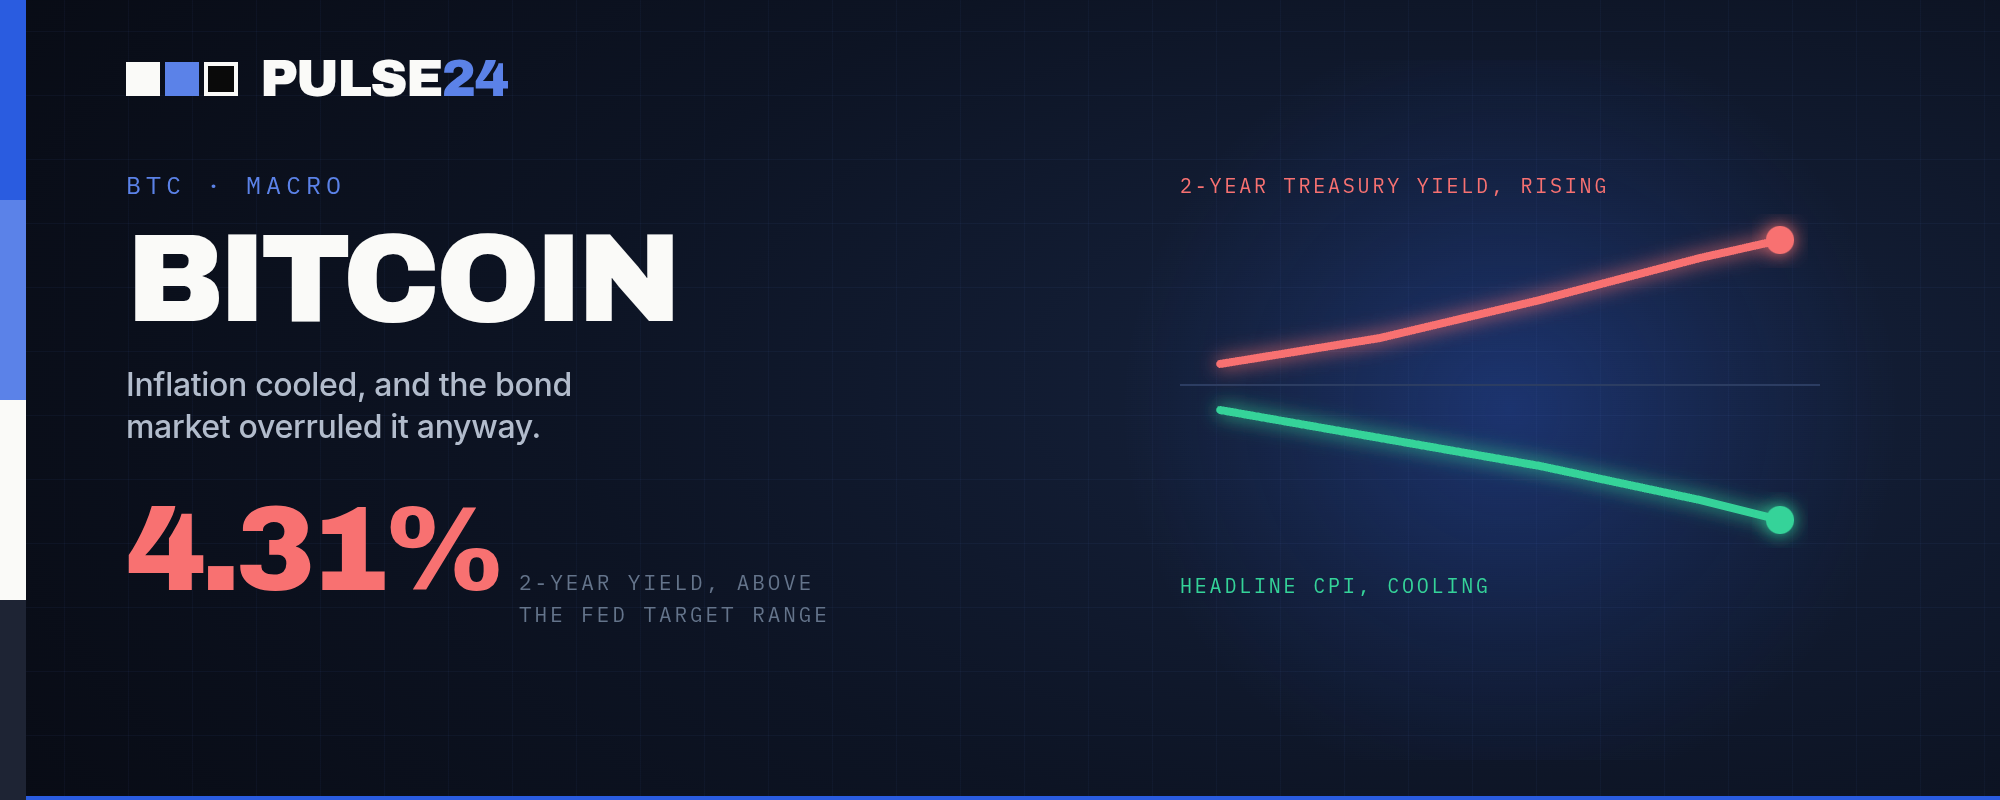
Bitcoin broke below $64,000 as a 2-year Treasury yield spike, fueled by oil's climb past $100, overrode a cooler-than-expected CPI report and drained crypto liquidity in the process.
What Changed
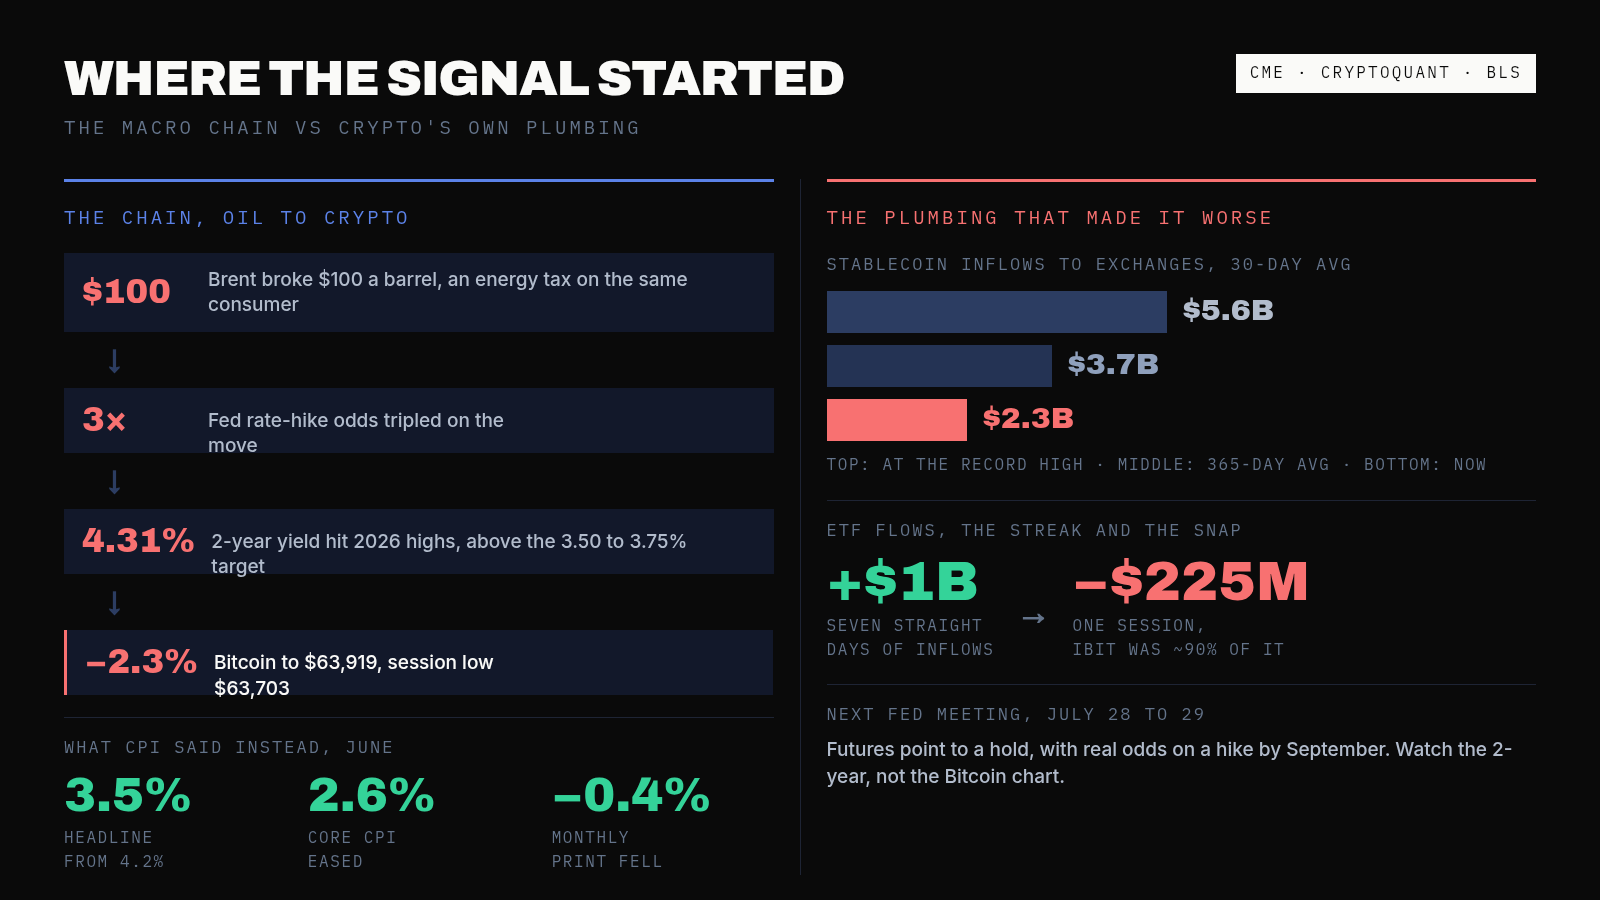
Bitcoin spent Friday sliding away from a level it had defended for more than a week. It dropped 2.3% to $63,919, breaking below the $64,000 floor that traders had been watching since a bounce off July's lows near $57,735, with the session ranging as low as $63,703 before a shallow recovery. For a market that had just logged seven straight days of ETF inflows totaling nearly $1 billion, the reversal landed hard.
The proximate cause is not a crypto-specific scare. It's the bond market. The 2-year Treasury yield, the maturity most sensitive to Fed policy expectations, climbed as high as 4.31% intraday before closing near 4.33%, a level well above the Fed's own 3.50%-3.75% target range and, according to Mosaic Asset Company, part of what the firm called massive moves underway across the yield curve. That's happening despite a June CPI report that came in soft: headline inflation cooled to 3.5% year over year from 4.2%, core CPI eased to 2.6%, and the monthly print actually fell 0.4%. By the numbers, the Fed had room to relax. The bond market did the opposite.
The disconnect traces back to oil. When Brent crude broke $100 a barrel and Fed rate-hike odds tripled with it earlier this week, it reset the entire rate-expectations complex. Treasury yields hit 2026 highs on the move, as an energy-driven inflation scare overrode the disinflation signal from the CPI print. Higher oil prices function like a tax on the same consumers the CPI report said were catching a break, and traders priced that tension directly into the yield curve.
Crypto's own plumbing made the drop worse. CryptoQuant analyst Darkfost tracked stablecoin transfers onto exchanges, the deposits that typically precede new buying, at a 30-day average of just $2.3 billion, down from $5.6 billion when Bitcoin was near its record high and below even the trailing 365-day average of $3.7 billion. Fewer dollars parked in USDT and USDC waiting to buy dips means less of a floor under every leg down. Layer on Thursday's Bitcoin ETF numbers: a $225 million net outflow, with BlackRock's IBIT responsible for about 90% of the reversal, snapping a streak that had pulled in nearly $1 billion over the prior seven sessions. It could still turn out to be a one-session reset rather than a structural shift. The timing next to a 2-year yield pushing toward 4.33% makes that a harder case to argue with conviction.
Why It Matters
Bitcoin trading like a rate-sensitive asset isn't new, but the size of the move underscores how tightly crypto liquidity is now wired into the same yield curve that prices mortgages and corporate debt. When two-year yields sit more than half a point above the Fed's target range, every asset priced off risk-free returns gets pulled toward it, and Bitcoin, with no yield of its own, is one of the more exposed.
The stablecoin data adds a second, quieter signal. Bitcoin's price can bounce on futures positioning in a day. Stablecoin inflows measure something slower: whether new cash is actually queuing up to buy. A 30-day average roughly 40% below the trailing year suggests that queue has thinned out, which matters more for the next leg than any single day's ETF flow.
There's also a policy tell buried in here. The Fed held rates at 3.50%-3.75% at its June meeting, unanimously, and June's CPI gave it cover to keep holding. Oil's spike didn't change what the Fed said. It changed what the market believes the Fed will have to say next, and that repricing is happening in real time across yields, oil, and now crypto: the connected system Pulse24 tracks rather than three unrelated headlines.
What to Watch Next
The Fed's next meeting runs July 28-29. CME FedWatch currently points to a hold there, but futures assign real odds to a rate hike by September, one of two increases some traders now expect before year-end, a scenario that was barely on the table a month ago when June's CPI print looked like it had bought the Fed room to ease.
Watch the 2-year yield for direction more than the Bitcoin chart itself. If it keeps climbing past its recent 4.33% close, expect continued pressure on crypto and other long-duration risk assets regardless of what the ETF flow data does day to day. If oil cools back off from its recent spike, that yield move unwinds just as fast as it built, and Bitcoin's stablecoin-inflow problem becomes the more durable story left standing.
Also worth tracking: the Digital Asset Market Clarity Act, still stalled in the Senate over unresolved market-structure disputes. A resolution either way would matter more to institutional flows like IBIT's than any single week of price action.
The Pulse24 Take
This week is a clean example of how the macro chain actually works instead of how it gets described. Oil spikes, yields react, and every asset that competes with a risk-free two-year Treasury for capital: gold, tech multiples, Bitcoin, gets repriced whether or not anything happened in that asset's own market. Bitcoin's ETF outflow and softer stablecoin inflows are real signals, but they're downstream of a bond market that's currently overruling a disinflation report most investors haven't caught up with yet.
None of this means Bitcoin's medium-term case is broken. Institutional plumbing, ETF access, and a seven-day, near-billion-dollar inflow streak just last week say the demand is still there when conditions cooperate. It means the near-term path runs through the 2-year yield and, one step further back, through oil, not through anything crypto-specific. Traders treating this as an isolated crypto story are missing where the actual signal originated.
How we read the data
Curious how we get from raw data to a take like this? Our Trader's Toolkit walks through the tools we lean on.
Explore the Toolkit