Pulse24 Original
Silver Dropped 6% in a Single Session Last Week, More Than Double Gold's Decline. It's Still Down 51% From January's Record.
October 18, 2026
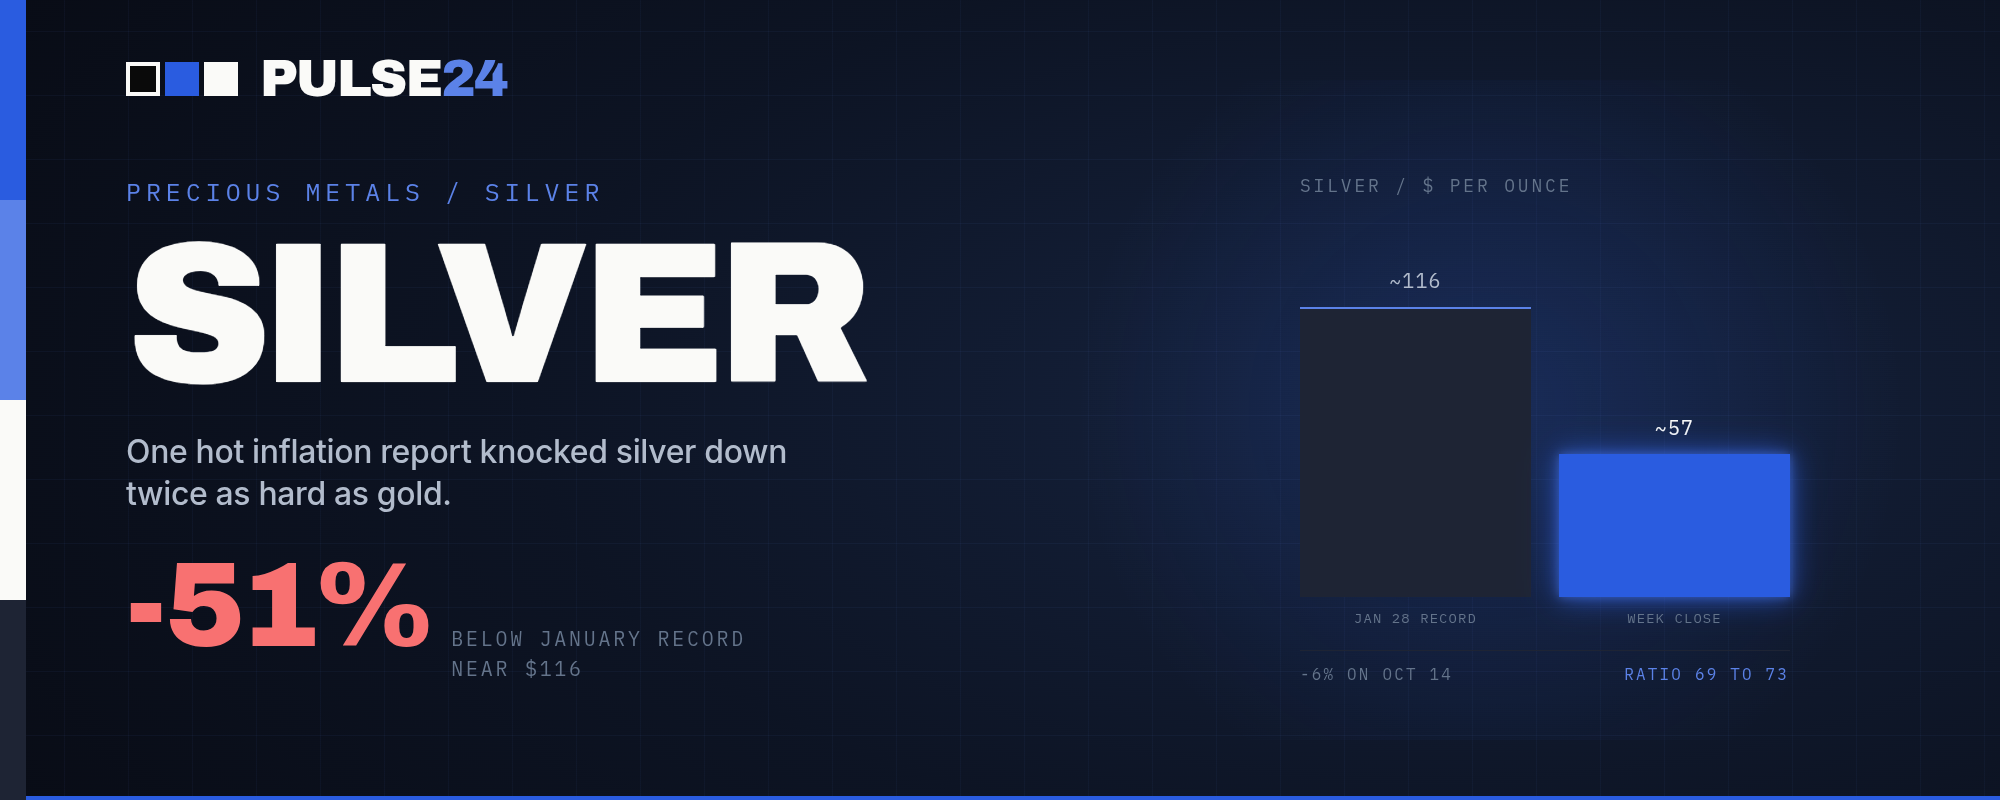
One hot inflation report knocked silver down twice as hard as gold last week, and the metal is still trading more than 50% below the record it set in January. The swing shows how closely precious metals are now tracking Fed rate bets.
Fifty-seven dollars. That's roughly where an ounce of silver closed out last week, a price that would have sounded absurd back in January, when the metal was setting records almost daily on its way past $115.
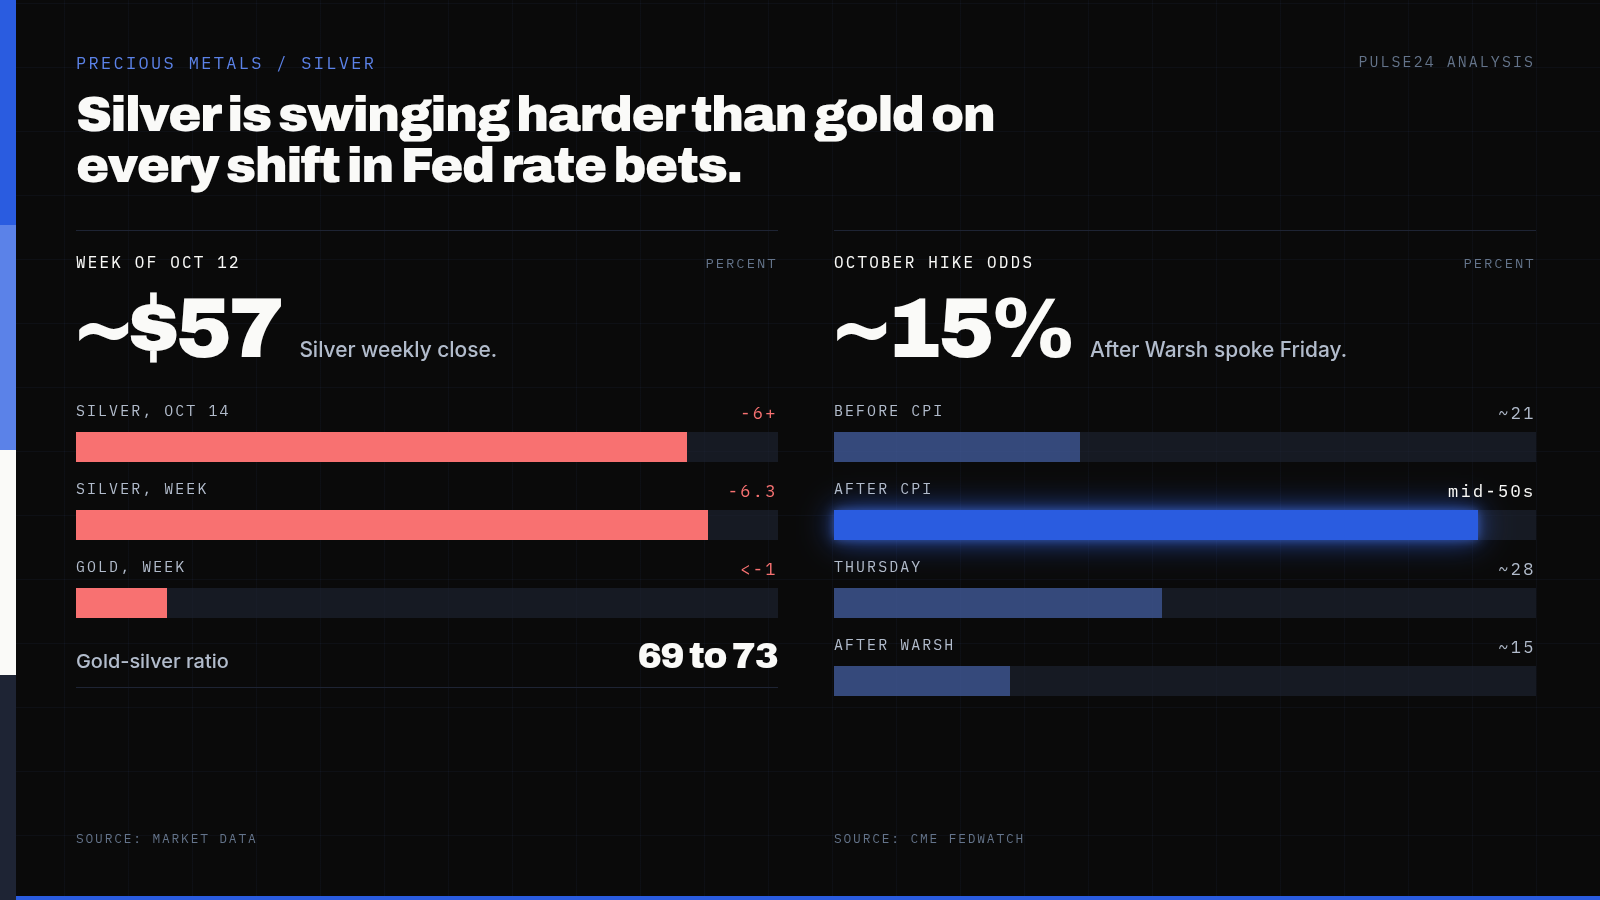
The high point came on January 28, 2026, when silver closed near a record $116 after touching an intraday peak near $122 the following session. Since then the slide has been steep and uneven, and last week offered a condensed lesson in why. Silver opened the week near $61, bottomed near $55 on Wednesday, and finished close to $57, a round trip of roughly $6 in five trading days.
The trigger was straightforward. September's consumer price index landed hotter than Wall Street expected, with prices up 3.7% year over year against a 3.6% forecast, gasoline up 9.1% on the month, and core inflation at 2.6%. CME FedWatch odds of an October rate hike, sitting around 21% beforehand, climbed as high as the mid-50s by the end of the session. The dollar firmed, the 10-year Treasury yield pushed back toward 5.3%, and precious metals sold off together. Silver took the harder hit, falling more than 6% in a single session, while gold slipped by a smaller margin.
Why Silver Moves Harder Than Gold
The gap in reaction isn't an accident. Investors hold gold mainly as a store of value, which keeps it somewhat insulated from economic data that doesn't touch a specific industry. Silver carries that same safe-haven pull, but more than half of annual demand comes from industrial buyers: electronics makers, solar panel manufacturers, and the automakers building EVs. That industrial tether makes silver more sensitive to the growth-versus-inflation question a hot CPI print reopens. When traders raise the odds of a Fed hike, they aren't only discounting future cash flows. They're also revising growth expectations that matter more to an industrially linked metal than to gold.
The gold-silver ratio captures the gap well. It opened last week near 69 and closed near 73, meaning an ounce of gold was worth about 73 ounces of silver by Friday, up from 69 the Monday before. The ratio has historically averaged somewhere in the 50s and 60s, so a reading in the low 70s still suggests silver is cheap relative to gold by that measure, even after its crash from January's highs.
The Thursday Reversal
The selloff didn't last. September's producer price index also ran hot, up 1.3% on the month and 6.3% from a year earlier, the steepest annual pace since 2022. Markets had largely priced that outcome in after Wednesday's surprise, so instead of extending the rout, Treasuries rallied: the 10-year yield fell roughly 10 basis points in a single session, its sharpest one-day drop in more than a year. Part of that bond demand, according to trading-desk commentary, came from investors pulling money out of AI-related corporate credit and into government paper, a rotation that followed a stretch of weak pricing in AI infrastructure loans. Silver clawed back more than 3% on the move, outrunning gold's smaller bounce, and the odds of an October hike eased to about 28%.
They fell further on Friday. Speaking at an IMF event in Bangkok, Fed Chair Kevin Warsh gave no hint of another rate hike this year, telling reporters, "I don't prejudge meetings." He called artificial intelligence probably the most consequential economic change of his lifetime, while warning the transition could be "very bumpy." CME FedWatch odds of an October hike slid to around 15% afterward, and the dollar index, which had touched an 18-month high earlier in the week, eased back toward 101.9. Silver held most of Thursday's gain, closing the week out near $57.
What to Watch Next
The next real test lands at the Fed's October 27 to 28 meeting. With hike odds now sitting near 15%, a pause looks like the more likely outcome, and a pause could extend last week's rebound, particularly if investors keep favoring Treasuries over AI-linked credit. A surprise hike would hit both metals, though silver's industrial-demand profile means it would probably take the bigger leg down. Either way, a $6 round trip in five sessions is a wide range for a single week, and it suggests silver's adjustment since January still has volatility left to work through rather than settling into a calmer, more predictable trend.
The Pulse24 Take
Silver's crash from January's record isn't really a story about the metal losing its appeal. It's a story about how fast a metal with heavy industrial exposure can get whipsawed when inflation data and Fed expectations move in the same direction at once. Gold offers a comparatively clean read on rate expectations alone. Silver offers a messier one, blended with judgments about industrial demand, solar buildout, and now, apparently, the health of AI-linked credit markets. That makes silver a noisier trade, but also a more revealing one. When the gold-silver ratio widens the way it did last week, it's usually a sign that fear is setting the price more than fundamentals are. Whether that fear fades before the October 27 meeting probably has less to do with silver supply and demand than with how the next inflation print reads. For now, $115 looks less like a floor silver will retest soon and more like a peak set during conditions that took a specific, synchronized burst of inflation surprises to produce, and traders treating last week's bounce as the start of a new uptrend should remember how quickly the move went the other way just two days earlier.
How we read the data
Curious how we get from raw data to a take like this? Our Trader's Toolkit walks through the tools we lean on.
Explore the Toolkit