Pulse24 Original
A Liquidity Gauge That Preceded 2008 and 2022 Turned Negative in June. AI Stocks Have Traded Sideways Ever Since.
September 5, 2026
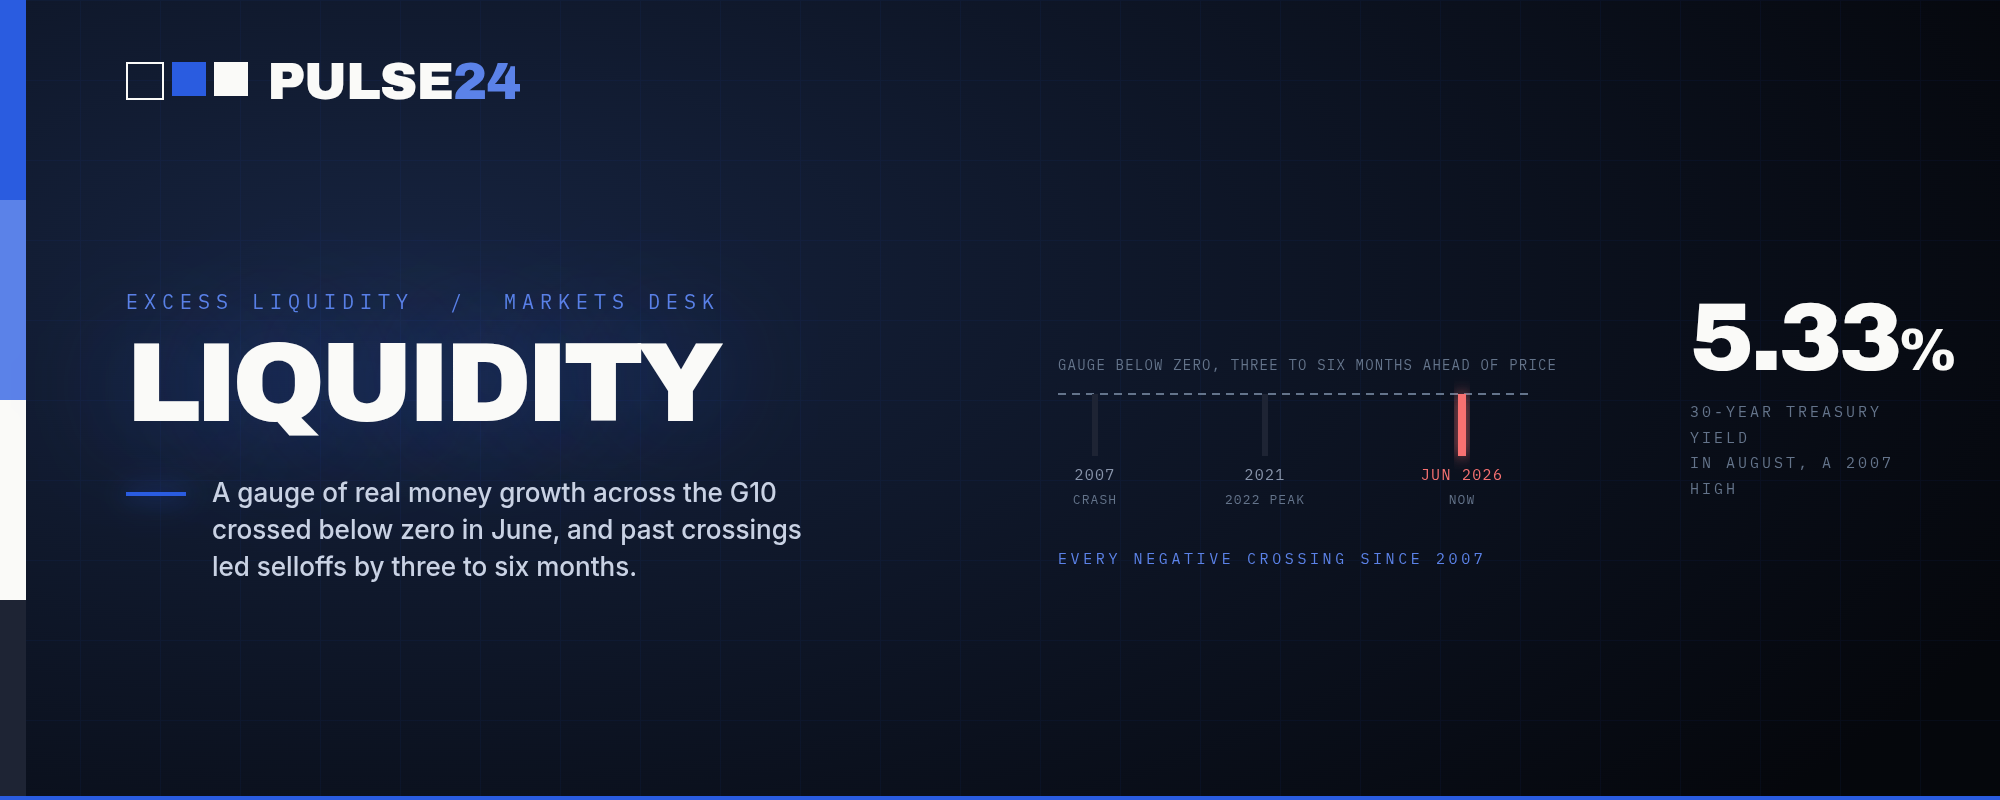
A Bloomberg liquidity gauge that preceded the 2008 crash and the 2022 selloff turned negative in June for the first time since 2021, and AI stocks have traded flat for four months despite record revenue and backlog growth. Rising 30-year yields and record corporate bond issuance are adding to the squeeze.
Bloomberg strategist Simon White tracks a measure of excess liquidity spanning the ten largest developed economies, essentially how much money is sloshing through the system after accounting for inflation and real growth. In June, that measure crossed below zero. It hadn't done that since 2021.
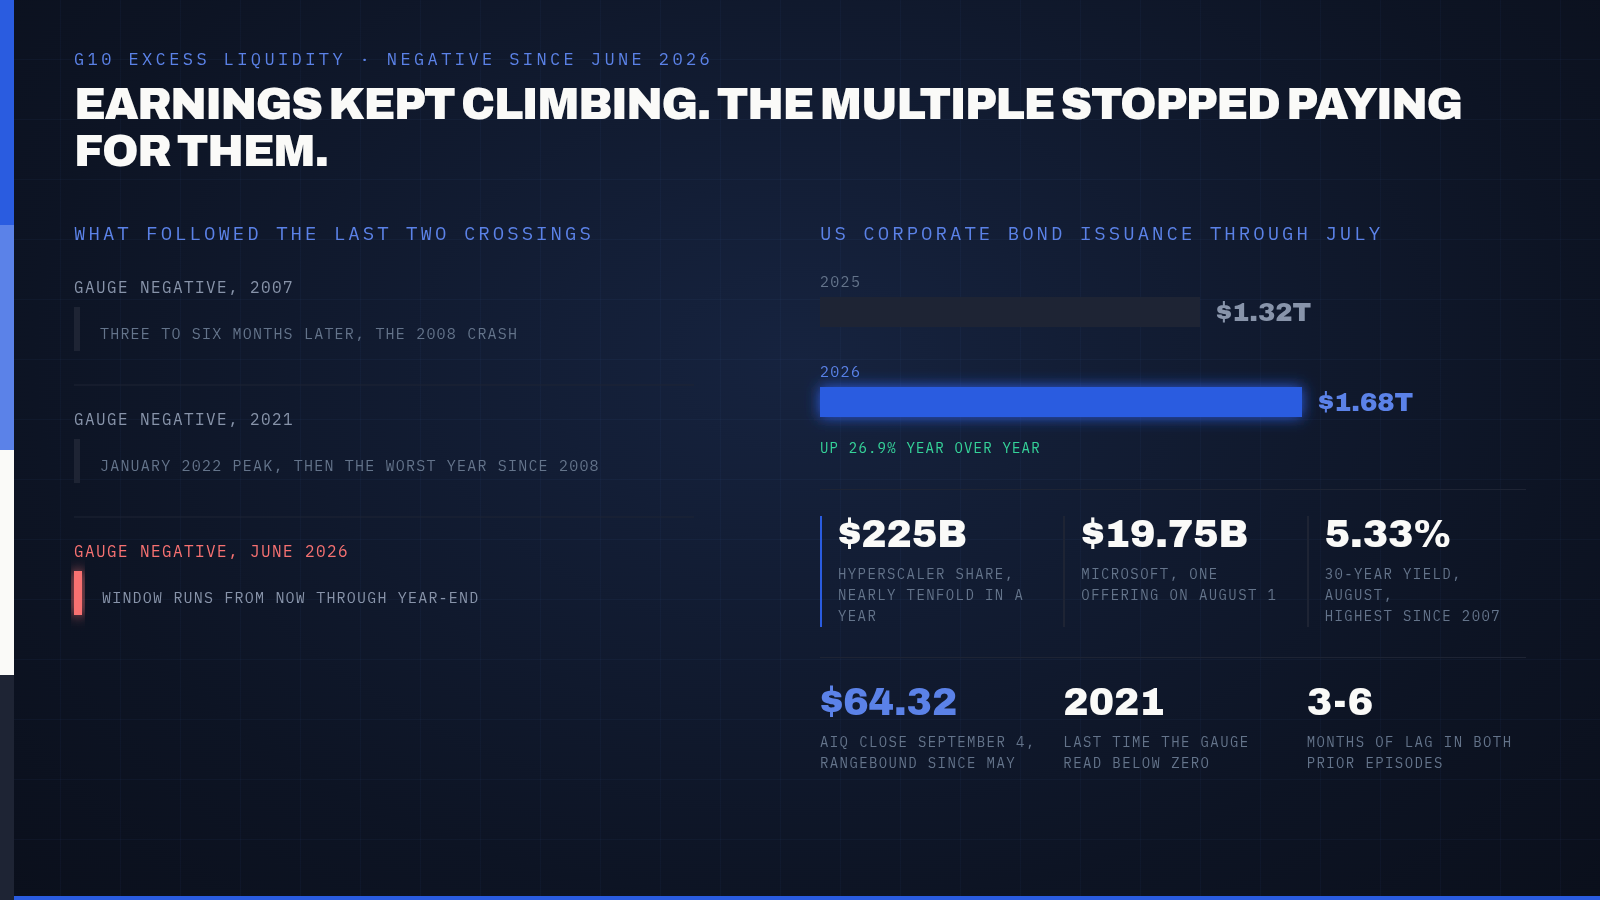
The timing matters because of what tends to happen next. White's gauge turned negative in a similar way before the 2008 financial crisis and again in the months leading into the market's January 2022 peak. Both times, stocks kept climbing for a while afterward. The lag ran three to six months before the excess money drying up actually showed up in prices. That puts the current window somewhere between now and year-end.
What Changed
White's excess liquidity indicator isn't a stock price or an index. It measures the gap between money supply growth and what the real economy actually needs to function, adjusted for inflation. When that gap is positive, the extra cash tends to spill into risk assets and inflate what investors are willing to pay for a dollar of earnings. When it flips negative, the real economy is absorbing money faster than central banks are supplying it, and the cushion under valuations gets thinner.
That's roughly what happened heading into 2022. The S&P 500 went on to post its worst year since 2008, and bitcoin lost more than three-quarters of its value before the dust settled. Nobody is predicting a repeat of that scale this time. White himself has stopped short of forecasting a crash, describing the more likely risk as a sharp but contained correction rather than a repeat of 2008's scale, with a deeper decline unlikely unless recession risk picks up alongside it.
Why It Matters
The most visible place this tension is already showing up is in AI stocks, and not in the way you'd expect from a sector still delivering blowout numbers. Global X's AI & Technology ETF, ticker AIQ, closed at $64.32 on September 4. InvestorPlace's Luke Lango points out the fund has been essentially rangebound since early May, even as the companies inside it keep reporting higher revenue, fatter backlogs, and bigger spending plans. Earnings estimates for the group have marched steadily upward over the same stretch.
Multiple expansion is what usually turns strong earnings growth into an even bigger stock move, and multiple expansion needs cheap, abundant capital to work. That's the part going missing. Real yields are climbing at the same time liquidity is draining, which squeezes valuations from both directions even when the underlying business results keep improving.
Rates are doing their part too. The 30-year Treasury yield hit 5.33% in August, the highest level since 2007, as investors demanded more compensation for holding long-dated government debt. That echoes a dynamic Pulse24 has flagged before: hyperscalers are on pace to borrow $175 billion this year alone to fund AI infrastructure, and all that new supply of corporate debt is landing in a market where long-term yields are already near two-decade highs.
Corporate bond issuance backs that up. US companies had sold $1.68 trillion in bonds through July, up 26.9% from the same point in 2025. Hyperscalers, Microsoft, Meta, Alphabet, Amazon, and Nvidia, accounted for roughly $225 billion of that on their own, a figure that's grown nearly tenfold in a single year. Microsoft alone raised $19.75 billion in a single offering on August 1. None of this is distress borrowing. It's confidence that AI demand justifies the debt. But it does mean more paper competing for the same shrinking pool of liquidity, and the market for insuring that debt against default is already pricing in some of that strain.
What to Watch Next
The next three to four months are the actual test of White's indicator, since that's the window his own model points to. Watch whether the excess liquidity measure stays negative through the fall or bounces back toward zero as central banks respond to slowing growth. A quick rebound would blunt the signal considerably.
Also worth watching: whether AI-linked stocks keep decoupling from their own earnings. If AIQ and similar baskets stay flat through another round of strong hyperscaler results this fall, that's a stronger confirmation that liquidity, not fundamentals, is setting the ceiling. And keep an eye on long-end yields. A 30-year rate that keeps grinding higher past 5.33% would tighten the vice further, regardless of what White's liquidity gauge does next.
The Pulse24 Take
Strong earnings and a stalling stock price can coexist for a while before something gives. That's the position AI-related equities are sitting in right now, and the excess liquidity signal offers one explanation for why paying more for the same dollar of earnings has stopped working the way it did a year ago.
This isn't a call to abandon the AI trade. The demand backdrop, judging by backlogs and spending plans, still looks real. It's a reminder that valuation and fundamentals are two different questions, and right now the market is answering them differently. A correction along those lines, sharp but not catastrophic, is the more likely outcome by White's own framing, and investors who've been riding multiple expansion rather than earnings growth are the ones with the most to recheck in their assumptions before year-end.
How we read the data
Curious how we get from raw data to a take like this? Our Trader's Toolkit walks through the tools we lean on.
Explore the Toolkit