Pulse24 Original
Ethereum's Utility Case Has Never Been Stronger. Its Price Still Can't Escape Bitcoin's Shadow.
July 26, 2026
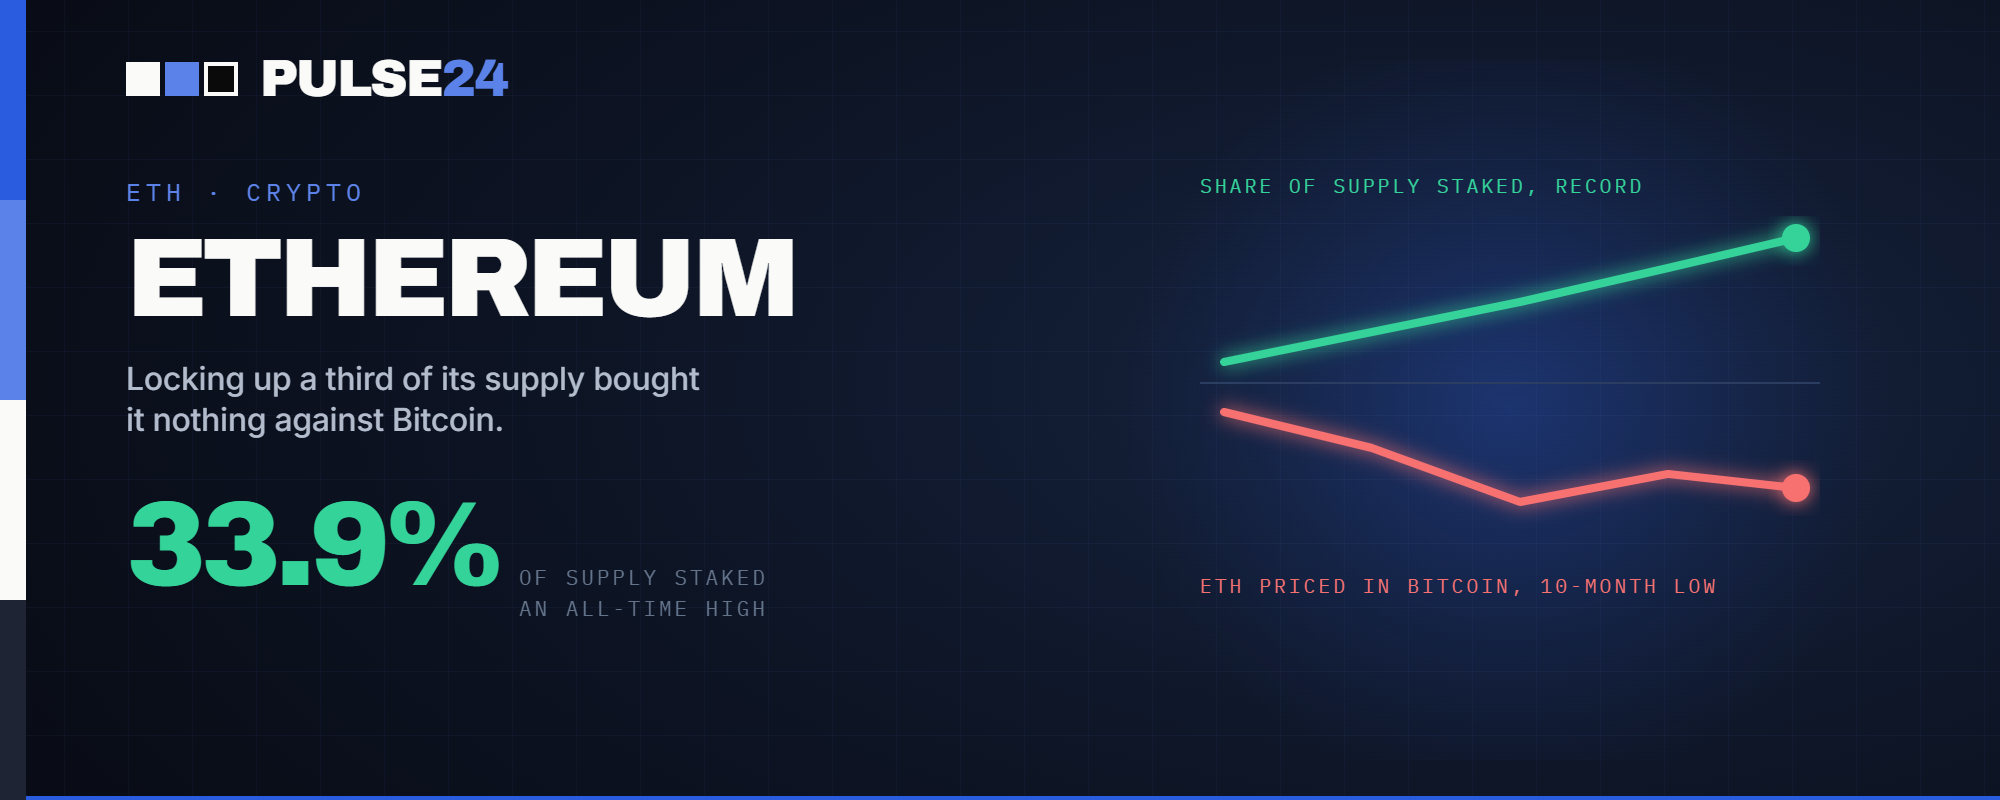
Ethereum just hit a record staking rate of 32.55% of supply, yet its price keeps losing ground to Bitcoin. The utility case is real; the market just hasn't found a way to pay for it the way it pays for Bitcoin's simpler story.
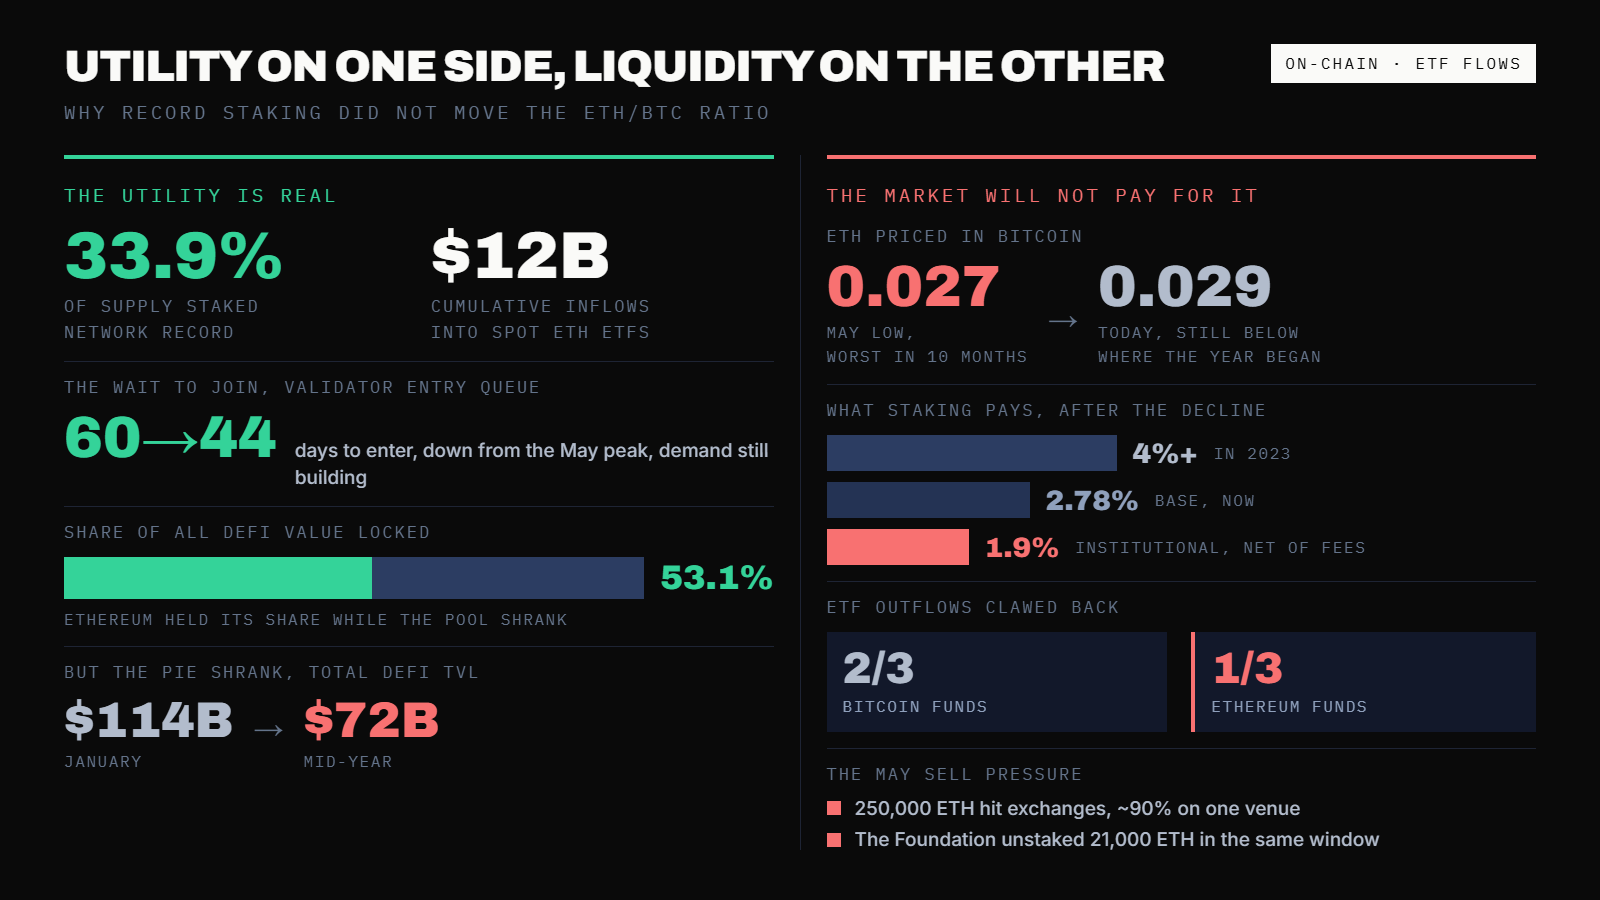
Ethereum just hit a record. More than a third of all ETH in existence, roughly 33.9% of supply, is now locked in staking. That's the highest share in the network's history. The queue to join is still long too: new validators are waiting around 44 days to get in, down from a peak above 60 days back in May.
Priced against Bitcoin, though, Ethereum is sitting near its worst level in almost a year. The ETH/BTC ratio touched 0.027 in May, a 10-month low, and even after a partial bounce it's still down near 0.029 today. Bitcoin's share of the total crypto market has climbed toward 60% over the same stretch.
Something doesn't add up. Record staking participation is supposed to be the clearest signal a market can send that an asset has real utility, real demand, real reasons to hold it. So why isn't any of that showing up in ETH's price relative to Bitcoin?
That's the chain worth pulling apart, because the answer isn't "ETH has no utility." It's that utility and liquidity are turning out to be two different things, and the market has only been willing to pay for one of them.
What Changed
The ETH/BTC ratio's slide to 0.027 in May wasn't an isolated wobble. It came alongside a concentrated 250,000 ETH inflow to exchanges, roughly 90% of it landing on Binance in a pattern that looks like organized selling rather than routine churn. In an ironic twist, the Ethereum Foundation itself unstaked over 21,000 ETH from Lido in the same window, undercutting the "everyone's staking, nobody's selling" story right as staking hit its all-time high.
Since then, ETH has had a real bounce against Bitcoin, though nowhere near enough to erase the year's slide. It's a recovery off a depressed base, not a trend reversal. The ratio is still below where it started the year, and Bitcoin's dominance hasn't given back much of what it gained.
Why It's Not About Utility, It's About Where the Utility Shows Up
Ethereum's scaling roadmap worked. Layer 2 networks now handle a huge share of the transaction volume that used to sit on Ethereum's mainnet. That's a genuine technical win, and it's also the problem.
Moving activity to L2s pulled transaction fees off the base layer with it, which means less ETH gets burned. Burn was supposed to be the mechanism that converted network usage into value accrual for ETH itself, the "ultrasound money" thesis. When fees leave mainnet, that mechanism goes quiet even while the network overall is busier than ever. JPMorgan's read on it was blunt: despite the upgrades, on-chain fundamentals hadn't meaningfully grown either. DeFi volumes plateaued. Total value locked sat below prior cycle highs.
Ethereum scaled itself right out of its own value-capture story.
The Liquidity Problem With Staking
Here's the part that trips people up: staking demand is genuinely enormous. The exit queue, ETH waiting to unstake, has been sitting at essentially zero for weeks, while the entry queue holds more than 2 million ETH waiting to get in. But staking doesn't pull in new money, it locks up money that's already there. It's a supply story, not a demand story.
And the reward for locking it up isn't especially exciting right now. Base staking yield has fallen to about 2.78%, down from over 4% in 2023. Even with MEV rewards layered on, validators are earning somewhere around 3.3% to 3.8%. BlackRock's institutional staking product nets holders just 1.9% to 2.2% after fees. When ETH's price is falling, a yield in that range doesn't come close to offsetting the capital loss, so staking isn't functioning as a magnet for fresh capital. It's a parking structure, not an on-ramp.
Why Institutional Money Keeps Choosing Bitcoin Anyway
The ETF flows make the preference explicit. Spot Ethereum ETFs have pulled in a respectable $12 billion cumulatively, but when the market wobbles, the recovery pattern is lopsided: Bitcoin funds have clawed back around two-thirds of prior outflows, Ethereum funds only about a third. On a single representative day in June, Bitcoin ETFs took in roughly $86 million while Ethereum ETFs saw their fourth straight day of outflows.
Institutional flows tend to concentrate in the simplest, most liquid, most legible story available, and right now that's Bitcoin: fixed supply, one clean thesis, nothing to explain beyond "digital gold." Ethereum's pitch is real but it's spread across five different things at once, L2 fee capture, staking yield, DeFi collateral, restaking, ETF wrappers, and none of them individually is compelling enough right now to be the reason a large allocator picks ETH first.
Leading a Shrinking Room
Ethereum still dominates decentralized finance, commanding 53.1% of all DeFi value locked, and that share has actually been growing. The problem is what it's a share of: total DeFi TVL has fallen more than a third this year, from roughly $114 billion in January to under $72 billion by mid-year.
Being the biggest fish in a shrinking pond isn't nothing, but it's not the kind of fresh-capital story that would let ETH's price decouple from Bitcoin's macro-driven cycle either. Dominance within a contracting category doesn't generate new demand on its own.
What To Watch Next
A few signals would actually indicate ETH is decoupling rather than just bouncing: Ethereum ETF flows turning consistently positive relative to Bitcoin's, not just for a day or two. DeFi TVL growing again in absolute dollar terms, not only as a larger slice of a smaller pie. Some redesign of fee-sharing between mainnet and L2s that restores ETH's burn mechanism. And the staking queue converting into genuinely reduced float, without concentrated holders like the Foundation offsetting it with sales.
None of those are impossible. None of them have happened yet either.
The Pulse24 Take
Ethereum's utility case isn't fake. Record staking, dominant DeFi share, real infrastructure demand, these are not manufactured numbers. But utility and liquidity are different levers, and right now only one of them is getting paid.
Bitcoin's price is carried by a single, simple, macro-legible story that institutional flows can underwrite without needing to understand validator queues or L2 fee capture. Ethereum's story is real but distributed across five mechanisms, and each one on its own is fine, not great: a sub-3% yield, a shrinking DeFi pie it still leads, a burn mechanism its own scaling success undermined.
Until one of those levers becomes undeniable in absolute terms, not just relative to a smaller pie or a depressed base, ETH will keep trading like Bitcoin's higher-beta shadow rather than snapping onto a liquidity curve of its own.
How we read the data
Curious how we get from raw data to a take like this? Our Trader's Toolkit walks through the tools we lean on.
Explore the Toolkit