Pulse24 Original
Silver's Broken Parabola: What Actually Changed
July 16, 2026
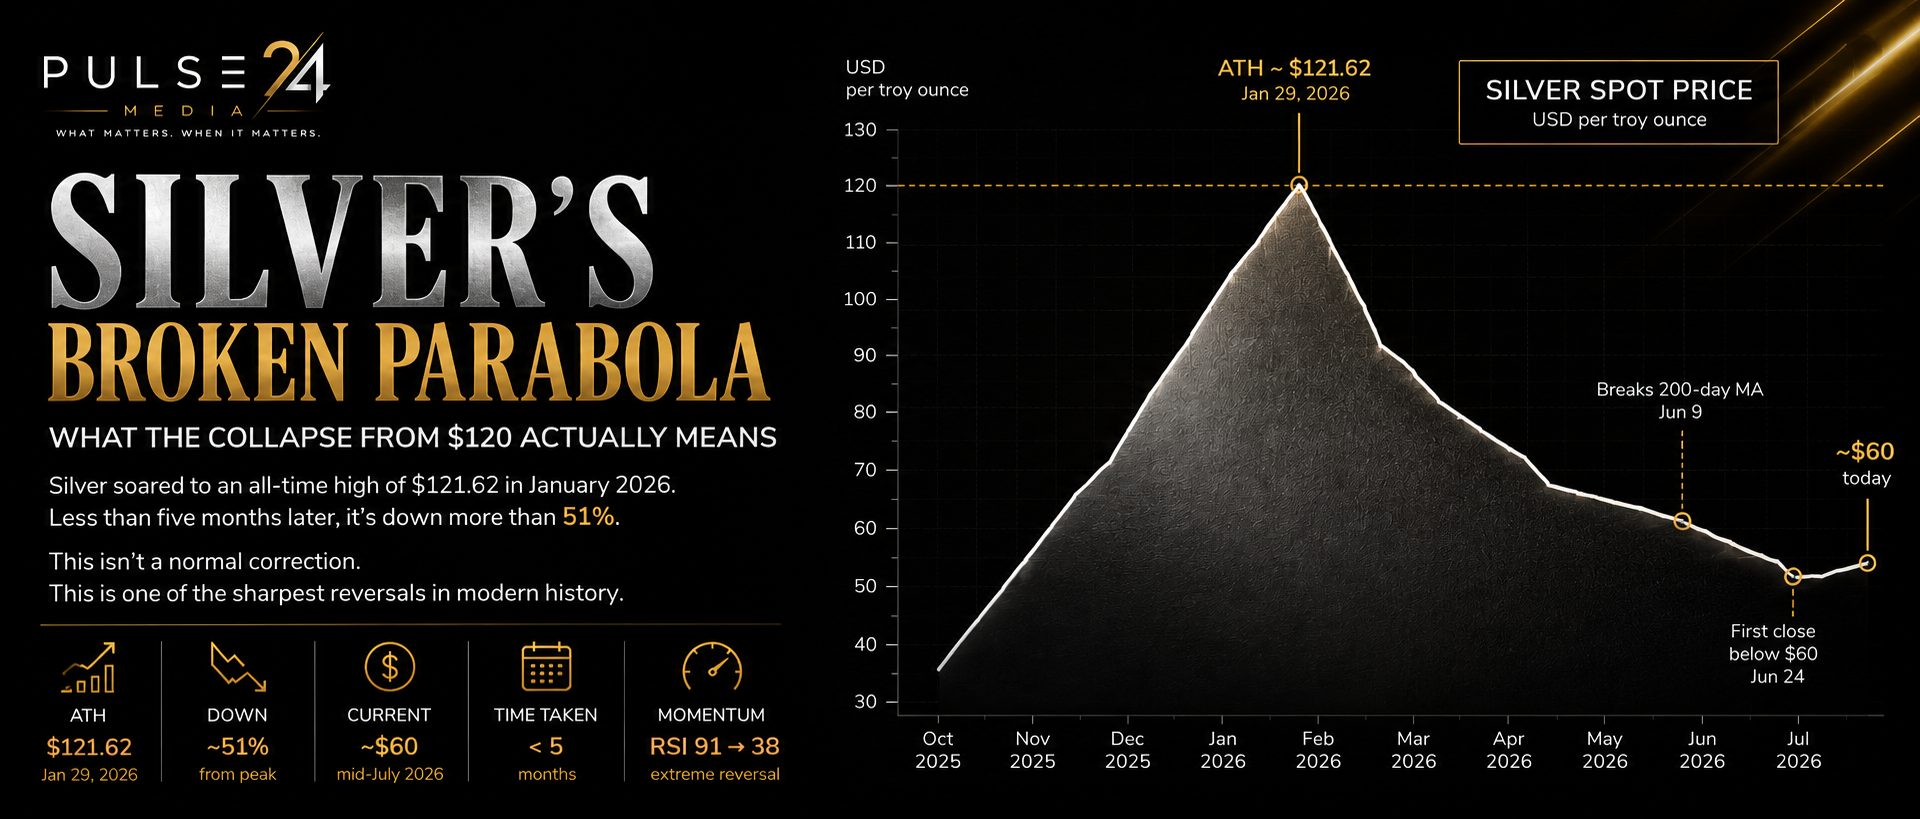
Silver has fallen roughly 51% from its January 2026 all-time high near $121.62, giving back nearly half of one of the fastest rallies any major asset has produced. The move isn't isolated profit-taking, it's a macro chain running from Middle East-driven oil prices through a hawkish Fed to a stronger dollar that weighs on gold, and silver amplifies every move gold makes. Bank targets clustering between $75 and $80 suggest the setup from here is consolidation, not capitulation.
Silver didn't just correct. It erased nearly half of one of the fastest rallies any major asset has ever produced.
Six months ago, traders were debating whether silver could reach $150. Today the conversation has shifted to whether the worst is finally over. Silver touched an all-time high near $121.62 in late January 2026. By mid-July it traded in the high $50s to low $60s, down roughly half from the peak.
The decline itself isn't the interesting part. Every asset that runs too far, too fast eventually gives some of it back. The interesting part is why this one happened, because almost every explanation floating around right now misses the actual mechanism.
Here it is, in one chain.
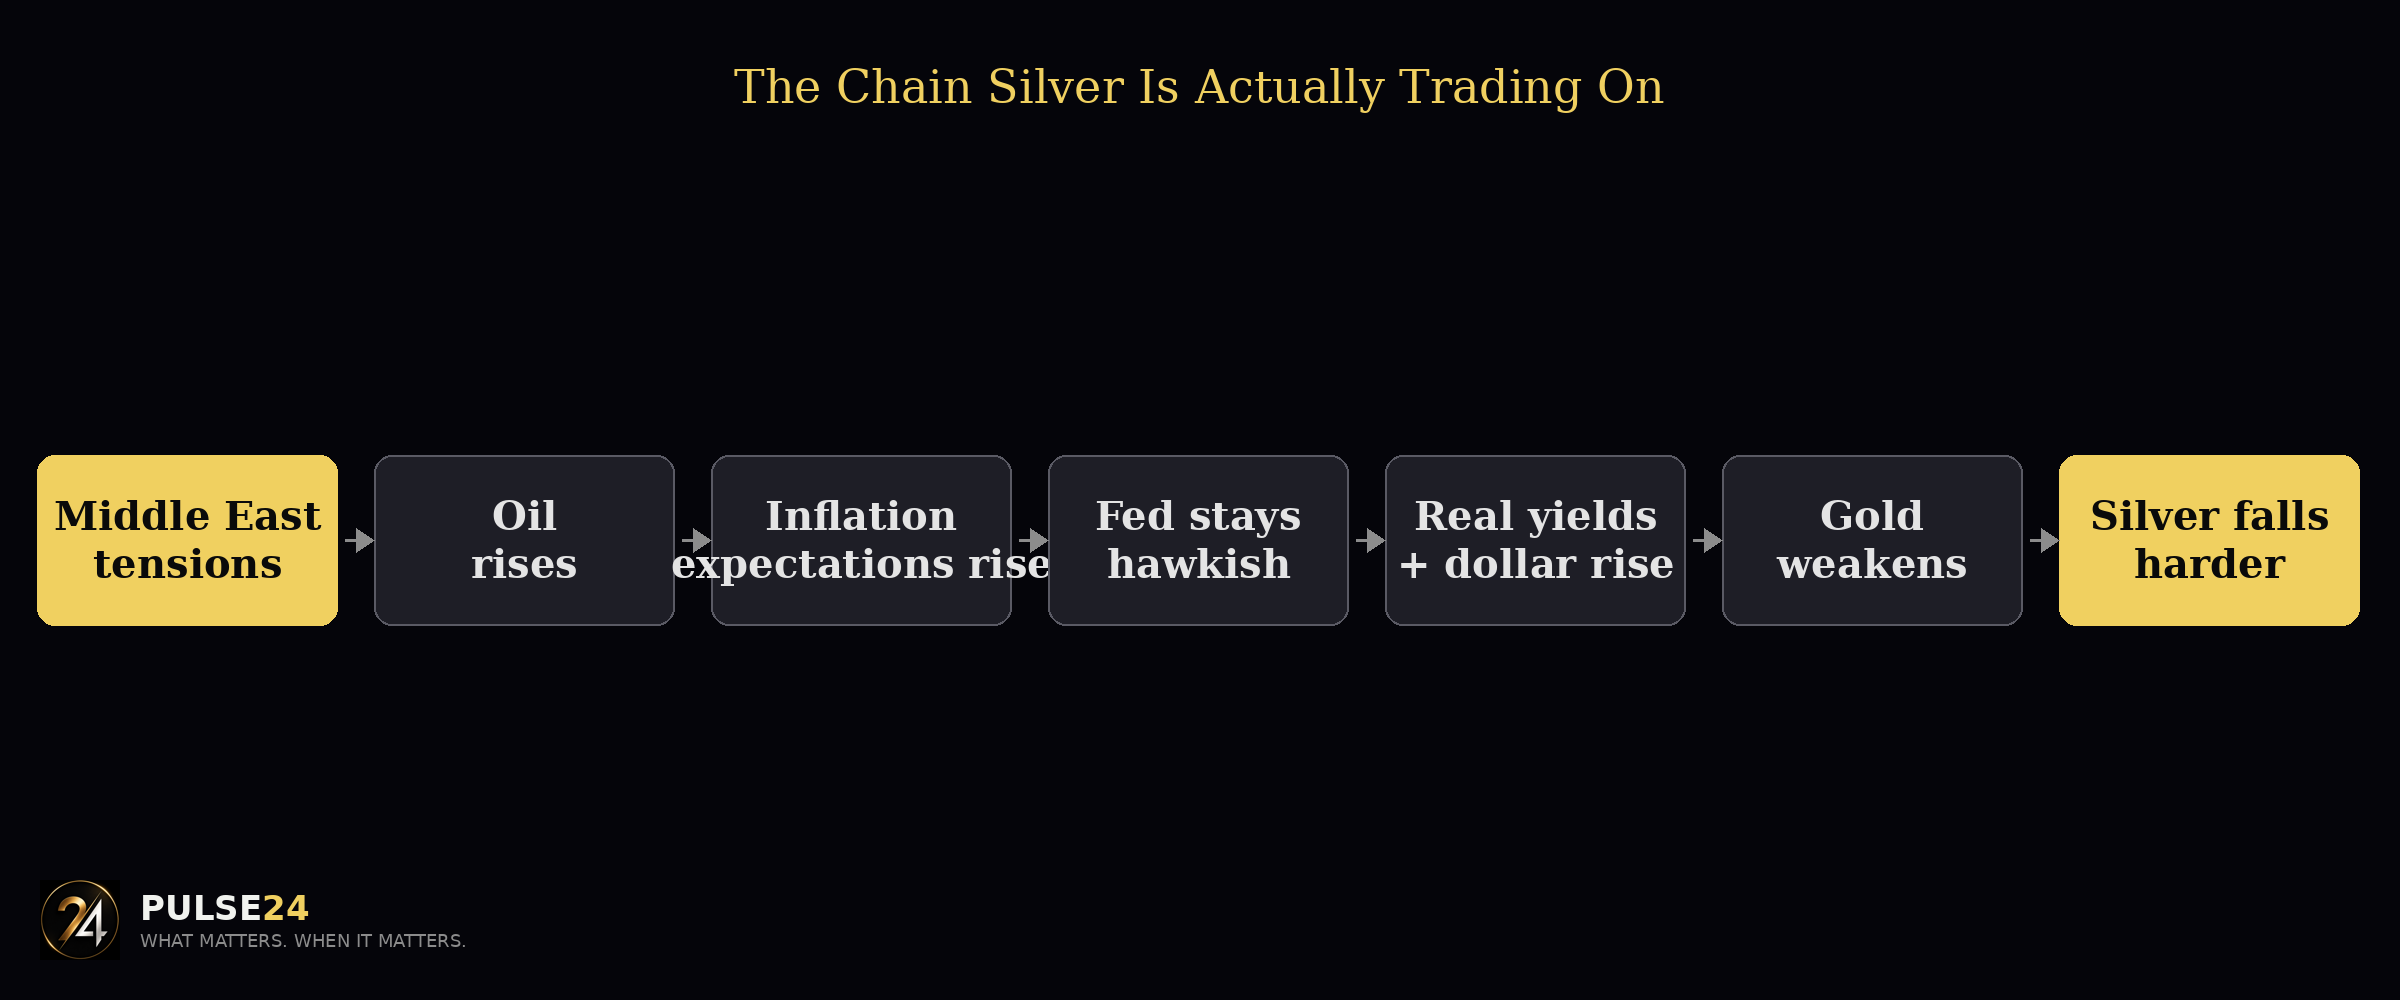
That chain is the spine of this entire piece. Everything below either builds toward it or flows out of it.
The Rally Was Real. That’s What Makes The Fall Confusing
Silver's move to $120 wasn't manufactured out of nothing. Six consecutive years of supply deficits left the market structurally short before any new demand even showed up, and over 70 percent of silver comes as a byproduct of mining copper, lead, and zinc, so supply barely responds to silver's own price. On top of that, gold's own historic run past $5,600 pulled silver along with it, the way silver almost always trails gold's big moves, but with more force in both directions.
By January, the gold-to-silver ratio, how many ounces of silver it takes to buy one ounce of gold, had compressed to 50 to 1, a 14-year low. Historically that ratio runs closer to 65 to 70 to 1. Silver had become, briefly, expensive relative to gold. That kind of compression rarely holds.
Why It Broke: The Chain, Not The Headlines
Most explanations for silver's crash point at one thing: profit-taking, a strong jobs report, the Iran conflict. They're all touching pieces of the same mechanism, but treated separately they miss the point.
Middle East tensions pushed oil higher. Higher oil pushed inflation expectations higher. Higher inflation expectations kept the Fed hawkish for longer than the market wanted. A hawkish Fed means higher real yields and a stronger dollar. A stronger dollar is the one thing that reliably weighs on gold. And when gold weakens, silver doesn't just follow, it amplifies the move, because silver trades as a higher-beta version of the same trade. A one to two percent down day in gold has, at points this year, shown up as a 10 to 15 percent down day in silver.
That's the whole story. Not "silver crashed because of profit-taking." Silver crashed because the dollar strengthened, and silver never trades independently of that.
Technically, the damage was visible early. Silver broke below its 200-day moving average on June 9 for the first time since April 2025, and weekly RSI collapsed from an extreme 91 down to 38 in a matter of months, one of the fastest momentum reversals the metal has produced in decades.
The obvious counterargument is that this was simply profit-taking after an unsustainable run, and that explanation covers part of the move. But it doesn't explain why gold weakened at the same time, why real yields rose through the same window, or why the broader precious metals complex underperformed together rather than silver alone giving back gains. Isolated profit-taking doesn't produce a synchronized move across gold, silver, and the dollar. A macro repricing does.
Who Actually Got Hurt
The forced selling concentrated in a specific place, and it wasn’t where most people assume. COMEX futures positioning stayed relatively disciplined even near the top, with managed money net long by a moderate 28,000 contracts as of early July, nowhere near the kind of crowded positioning that usually precedes real capitulation. Total open interest, however, has fallen more than 40 percent since October 2025, a genuinely large deleveraging event.
The real damage landed in leveraged ETPs, the 2x and 3x silver funds, and margined retail positions, both of which erase months of gains fast once a reversal starts. Meanwhile, patient capital largely held on. Silver-backed ETP holdings actually grew through 2025 to their highest level since mid-2022, and physical coin and bar demand rebounded double digits. The people who bought silver as a long-term position mostly stayed in it. The people who got wiped out were the ones using leverage to chase the parabola.
Is AI Demand Enough To Support Silver
One of the biggest misconceptions this cycle is that AI infrastructure alone can keep silver prices elevated.
AI demand for silver is real, it shows up in circuit boards, connectors, and conductive components across the buildout. But silver doesn't trade purely on industrial demand. It trades at the intersection of industrial demand, investment flows, real yields, and the dollar. Right now, the macro forces are simply bigger, and one specific industrial trend is working against silver at the same time: the solar sector, historically the largest driver of industrial silver demand growth, is actively adopting alternative metallization to use less silver per panel, as module oversupply squeezes manufacturer margins. The Silver Institute expects industrial demand to fall for a second straight year to a four-year low.
AI isn't the offset. The dollar is the drag. Those are two different forces, and right now only one of them is winning.
What The Setup Looks Like From Here
The gold-to-silver ratio is the cleanest read on this, because it strips out whatever the dollar is doing and just measures silver against its sister metal. At the correction’s worst point in May, the ratio blew out to nearly 88 to 1, silver historically cheap relative to gold. By mid-June it had already recovered to roughly 62 to 1, close to the long-run average. Silver has actually been outperforming gold on a relative basis since May, even while both keep sliding against the dollar together.
Bank targets reflect a market still working through this: UBS sees silver near $80 by year-end, HSBC nearer $75. None of them are calling for a return to $120 anytime soon, and none of them are calling for a collapse to new lows either. The setup looks like consolidation, not capitulation.
The Pulse24 Take
Silver isn't fighting its own fundamentals anymore. It's fighting the dollar.
Supply deficits still exist. Physical demand hasn't disappeared. AI infrastructure is still consuming silver, quietly, in the background.
But none of those forces have been large enough to offset a stronger dollar and higher real yields. That's the entire explanation, and it's simpler than the ten different reasons floating around social media right now.
Which means the next major move in silver probably won't begin in the silver market at all. It'll begin with inflation data, with the Fed, and ultimately with gold.
That's the chain the market is trading today.
How we read the data
Curious how we get from raw data to a take like this? Our Trader's Toolkit walks through the tools we lean on.
Explore the Toolkit