Pulse24 Original
Microsoft's Azure Topped $100 Billion in Revenue. Meta's Free Cash Flow Fell to $784 Million on the Same Night.
July 30, 2026
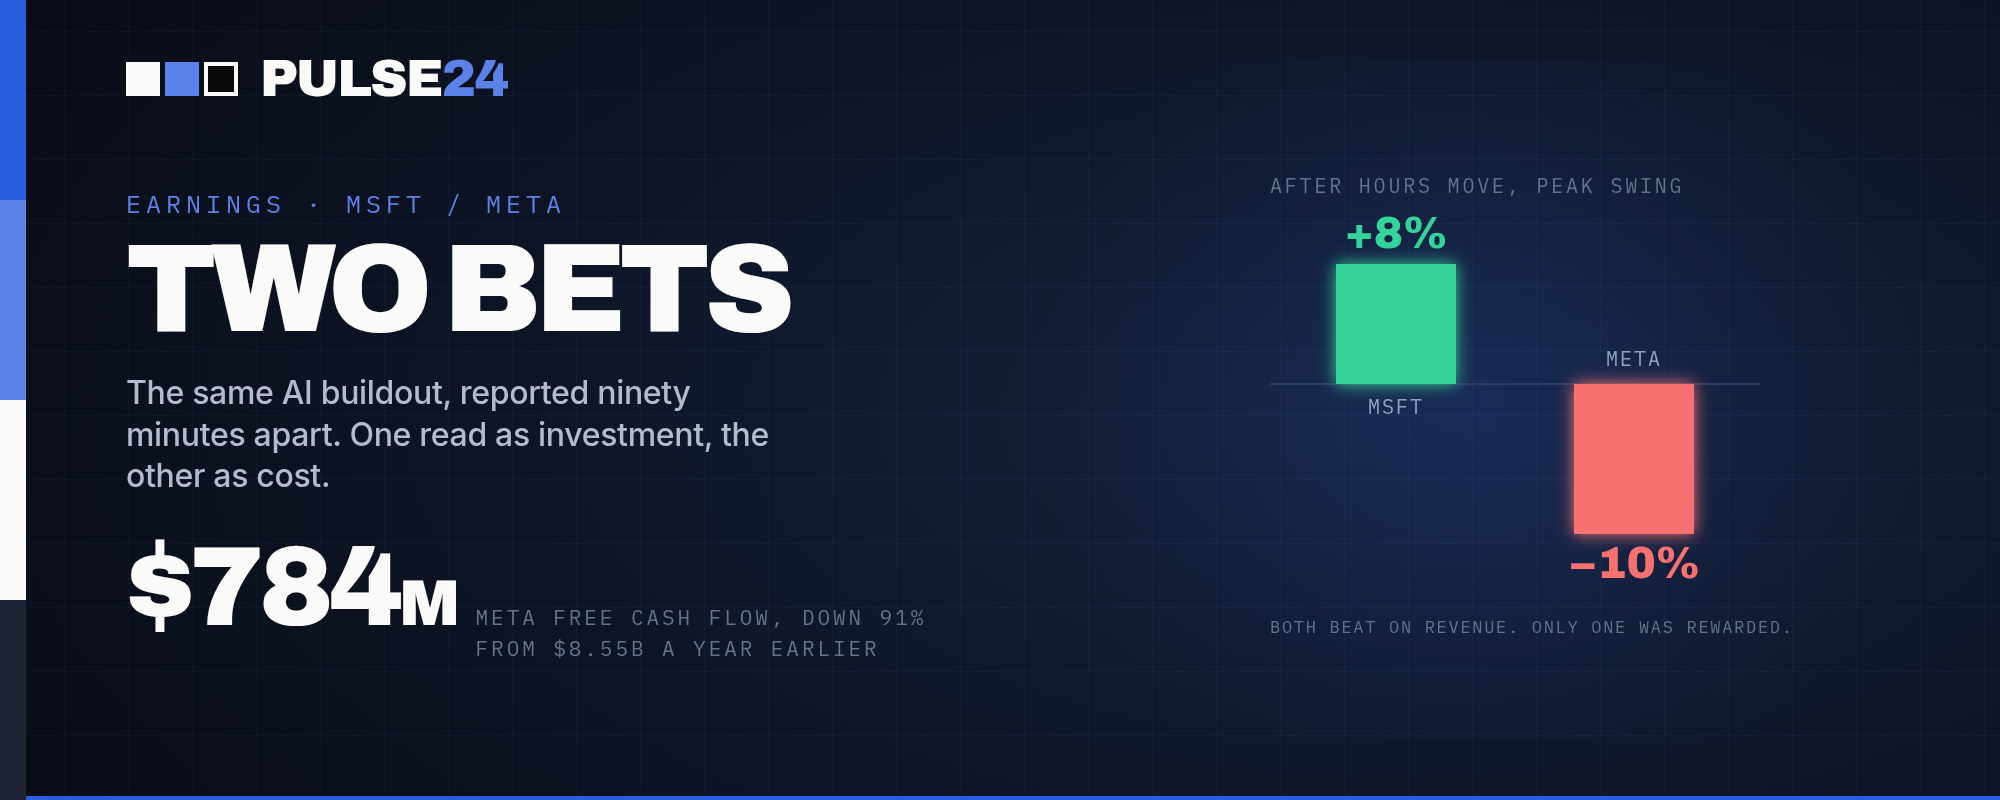
Microsoft's fiscal fourth quarter beat estimates on revenue, profit, and Azure growth, and shares rose as much as 8% after hours. Meta beat on revenue too, but its free cash flow collapsed to $784 million and shares fell as much as 10%, a sign investors are starting to price AI spending very differently depending on what it actually buys.
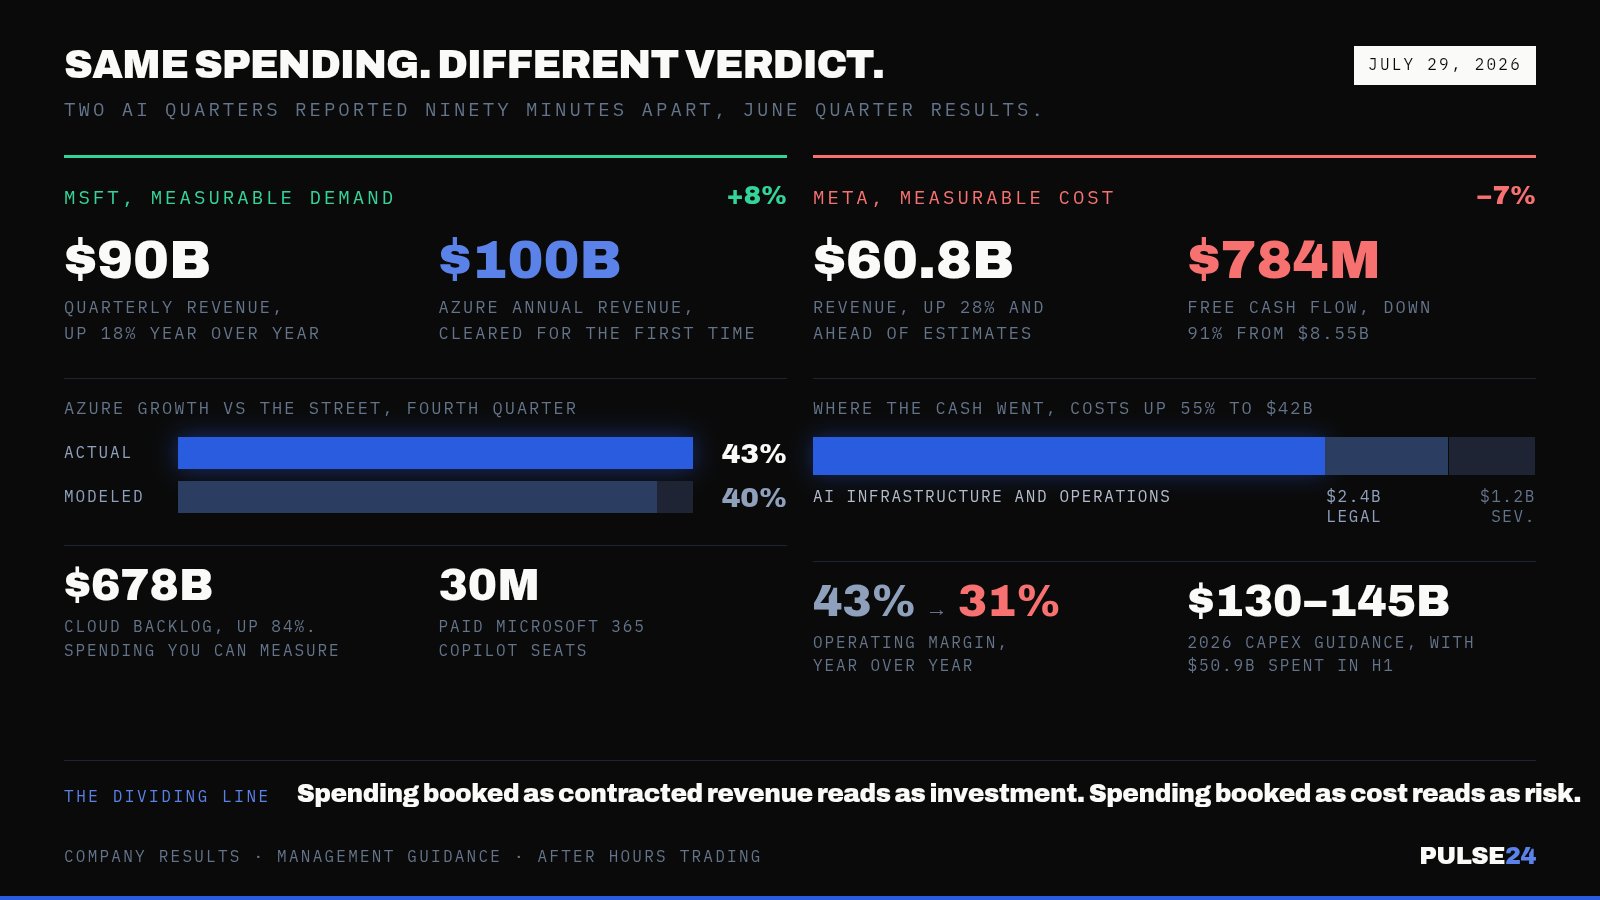
Azure closed Microsoft's fiscal year at just over $100 billion in revenue, the first time the cloud unit has cleared that mark in a twelve month span. Wall Street had been watching for it, and when Microsoft confirmed the number Wednesday evening alongside a quarterly beat on revenue and profit, the stock moved almost immediately, rising as much as 8% in after hours trading before paring back some of the gain.
Roughly ninety minutes later, Meta reported its own quarter, and investors reacted in the opposite direction. Revenue rose 28% year over year to $60.8 billion, ahead of what analysts had expected. Net income fell 14% to $15.8 billion. Free cash flow, the cash left over after running the business and funding capital projects, dropped to $784 million, down 91% from $8.55 billion in the same quarter a year earlier. Shares fell as much as 10% in after hours trading before recovering slightly to a decline near 7%.
What Changed
Both companies are spending heavily on the same underlying thing: AI data centers, custom chips, and the power contracts needed to run them. Wednesday's reaction showed investors are no longer treating that spending as one undifferentiated line item. They're asking whether it shows up as revenue this quarter or only as expense. Microsoft's Azure grew 43% in the fourth quarter, ahead of the 40% analysts had modeled, and its commercial remaining performance obligation, a rough proxy for future contracted cloud revenue, jumped 84% to $678 billion. That backlog gives investors a way to see the spending converting into demand they can actually measure.
Meta's spending told a murkier story. Total costs and expenses rose 55% to $42 billion, and management pointed to $2.4 billion in legal charges and $1.18 billion in severance costs on top of the infrastructure buildout. Operating margin compressed to 31%, down from 43% a year earlier. The company also narrowed its 2026 capital expenditure guidance to $130 billion to $145 billion, up from an already-raised $125 billion to $145 billion range set back in April, after spending $50.9 billion on capex in the first half of this year alone.
Meta's third quarter revenue guidance added to the unease. The company pointed to a range of $61 billion to $64 billion, with the midpoint landing below what analysts had penciled in. CEO Mark Zuckerberg framed the quarter as one where the core business held up, noting 3.6 billion people use at least one Meta app daily, even as spending accelerated. CFO Susan Li put it more directly, saying the industry has "underbuilt historically for the wave of AI adoption," an argument that the spending is catching up to demand rather than running ahead of it.
Why It Matters
The gap between these two reactions comes down to how investors are currently pricing AI capital spending. When that spending shows up as backlog, contracted revenue, or a cloud unit crossing a milestone the way Azure just did, the market treats it as investment. When it shows up mostly as higher costs and a cash flow number that's cratered, the market treats it as risk. Meta's free cash flow of $784 million this quarter, down 91% from $8.55 billion a year earlier, raises a specific question: how long heavy AI spending can continue before it meaningfully constrains the rest of the business.
This isn't a problem unique to Meta. Every major cloud and platform company is running some version of the same experiment, betting that AI infrastructure spending today converts into higher margin revenue later, whether that's Azure's cloud contracts, Meta's advertising tools, or the compute and intelligence products Zuckerberg has talked about selling directly. Wednesday's earnings produced two data points on that same experiment, released hours apart, with opposite verdicts from the market.
What to Watch Next
Apple and Amazon report their own results this week, and both carry pieces of this same debate. Amazon already had to sweeten a $25 billion bond sale earlier this month as investors grew choosier about who gets to borrow cheaply for AI buildouts, and its cloud unit will face the same backlog-versus-expense scrutiny that Azure and Meta just did. If Amazon's cloud growth and forward bookings look like Microsoft's, that's a sign the market's patience with AI capex remains intact. If its margins compress the way Meta's did, the debate widens beyond one earnings season.
Meta's own guidance suggests the spending pressure isn't easing soon. A capex range of $130 billion to $145 billion for 2026, on top of $50.9 billion already spent in the first half, means the second half could bring quarters with free cash flow even lower than this one. Whether Zuckerberg's bet on eventually selling intelligence at a premium to raw compute pays off will likely take several more quarters to show up in the numbers investors actually reward.
The Pulse24 Take
Wednesday didn't settle the argument over whether Big Tech is spending too much on AI. It sharpened it. Microsoft made the case that heavy AI investment can still produce a quarter analysts called a triple beat, with revenue, profit, and Azure growth all landing ahead of estimates. Meta made the opposite case just as clearly, showing what the same kind of spending looks like when it hits margins and cash flow before it hits the top line.
The two companies aren't really competing with each other in this comparison. Each is running its own version of the bet most of the market is currently making, that AI infrastructure spending eventually pays for itself. Microsoft's quarter is evidence that bet can work. Meta's quarter is a reminder of what it costs while investors wait to find out.
How we read the data
Curious how we get from raw data to a take like this? Our Trader's Toolkit walks through the tools we lean on.
Explore the Toolkit