Pulse24 Original
Credit Card Delinquencies Just Hit 12.8% of Balances, the Highest Since the Great Recession. New York Fed Researchers Say the Real Driver Is How Long Banks Keep Bad Debt on the Books, Not a Wave of New Defaults.
August 13, 2026
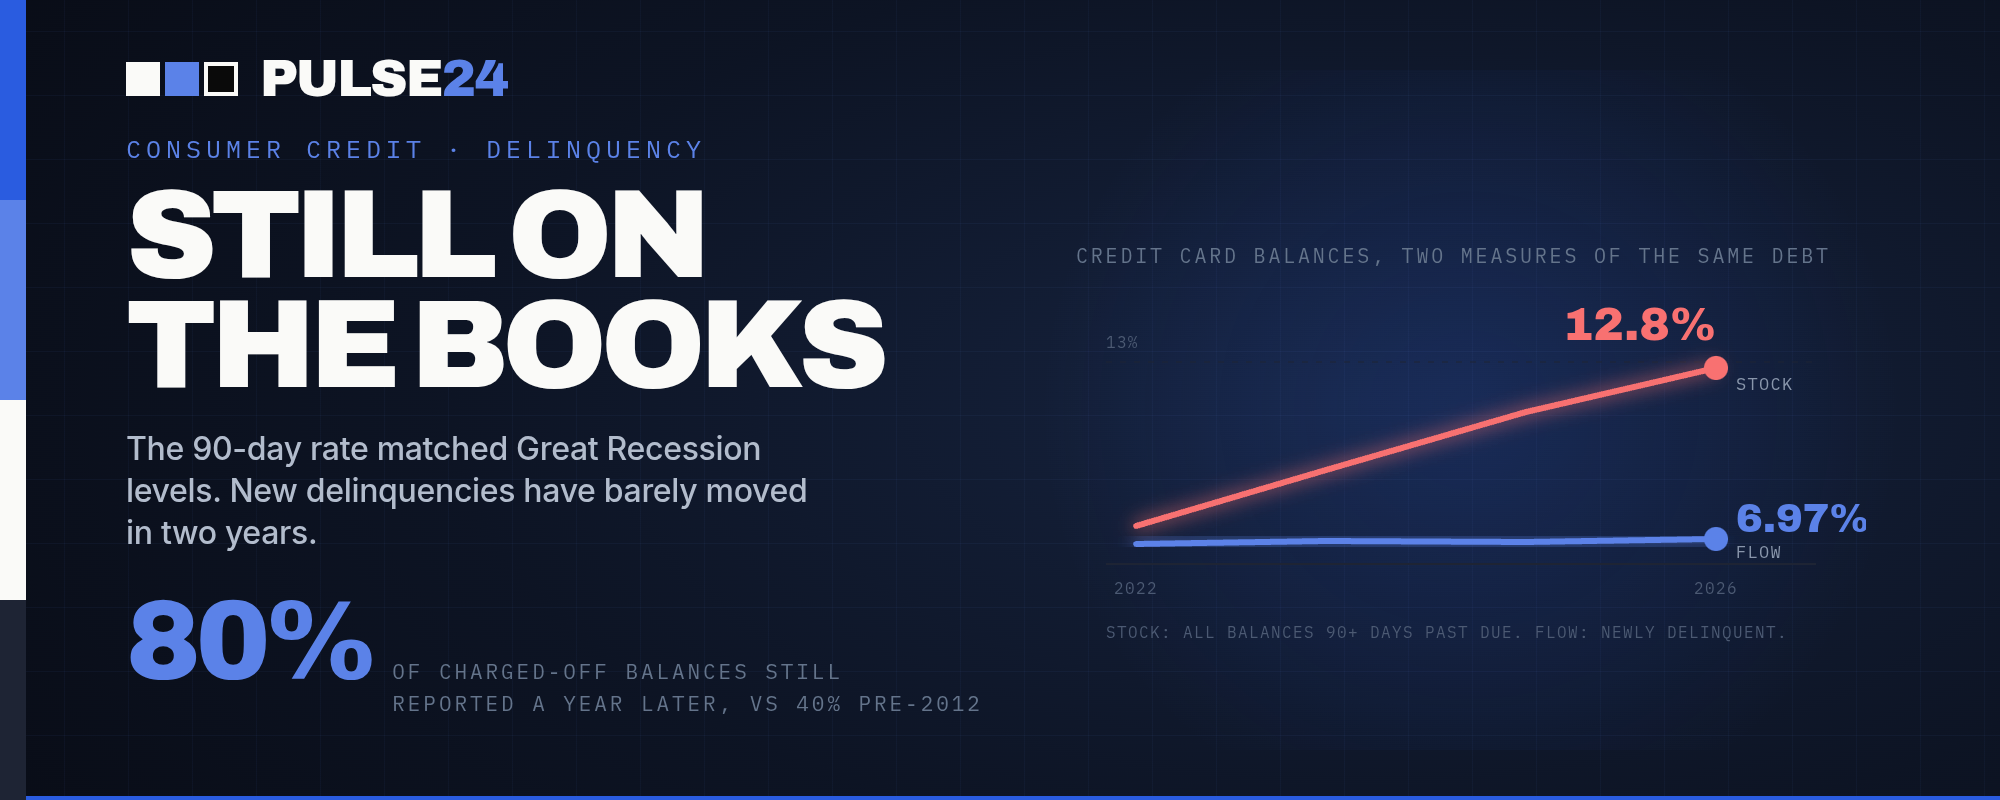
The share of credit card balances 90 days past due just matched levels last seen during the Great Recession, and it's being treated as proof the consumer is breaking. New York Fed researchers who track the same data found new delinquencies have barely moved in two years, and the climb owes more to how long lenders keep bad debt on the books.
Roughly 12.8% of all US credit card balances were 90 days or more past due in the first quarter of 2026. That's up from 7.6% in the third quarter of 2022, and it's the highest reading since the stretch of the Great Recession, when unemployment topped 9% and foreclosures were a daily headline. Marketplace, CNBC, and a wave of personal finance outlets picked up the number this month and ran with the obvious framing: American households are maxed out and starting to break.
Context matters here, though. Unemployment right now sits well below where it did in 2009 or 2010, wage growth has kept pace with inflation for most of the past year, and the New York Fed's own Q2 2026 household debt report, released August 11, shows total balances actually ticked down slightly last quarter. A delinquency rate matching Great Recession levels, in an economy that looks nothing like the Great Recession, is exactly the kind of mismatch that deserves a second look before anyone draws conclusions about where consumer spending is headed.
Two Ways to Measure the Same Debt
Economists at the New York Fed's Liberty Street Economics blog spent part of August untangling why the delinquency number looks so alarming when other consumer data doesn't match it. Their answer comes down to the difference between a stock measure and a flow measure. The stock rate, the 12.8% figure making headlines, counts every dollar currently sitting 90 or more days past due, no matter how long it's been stuck there. The flow rate tracks something different: how much previously current debt became seriously delinquent in a given quarter. That flow rate, according to the Fed's research, has been essentially flat for almost two years.
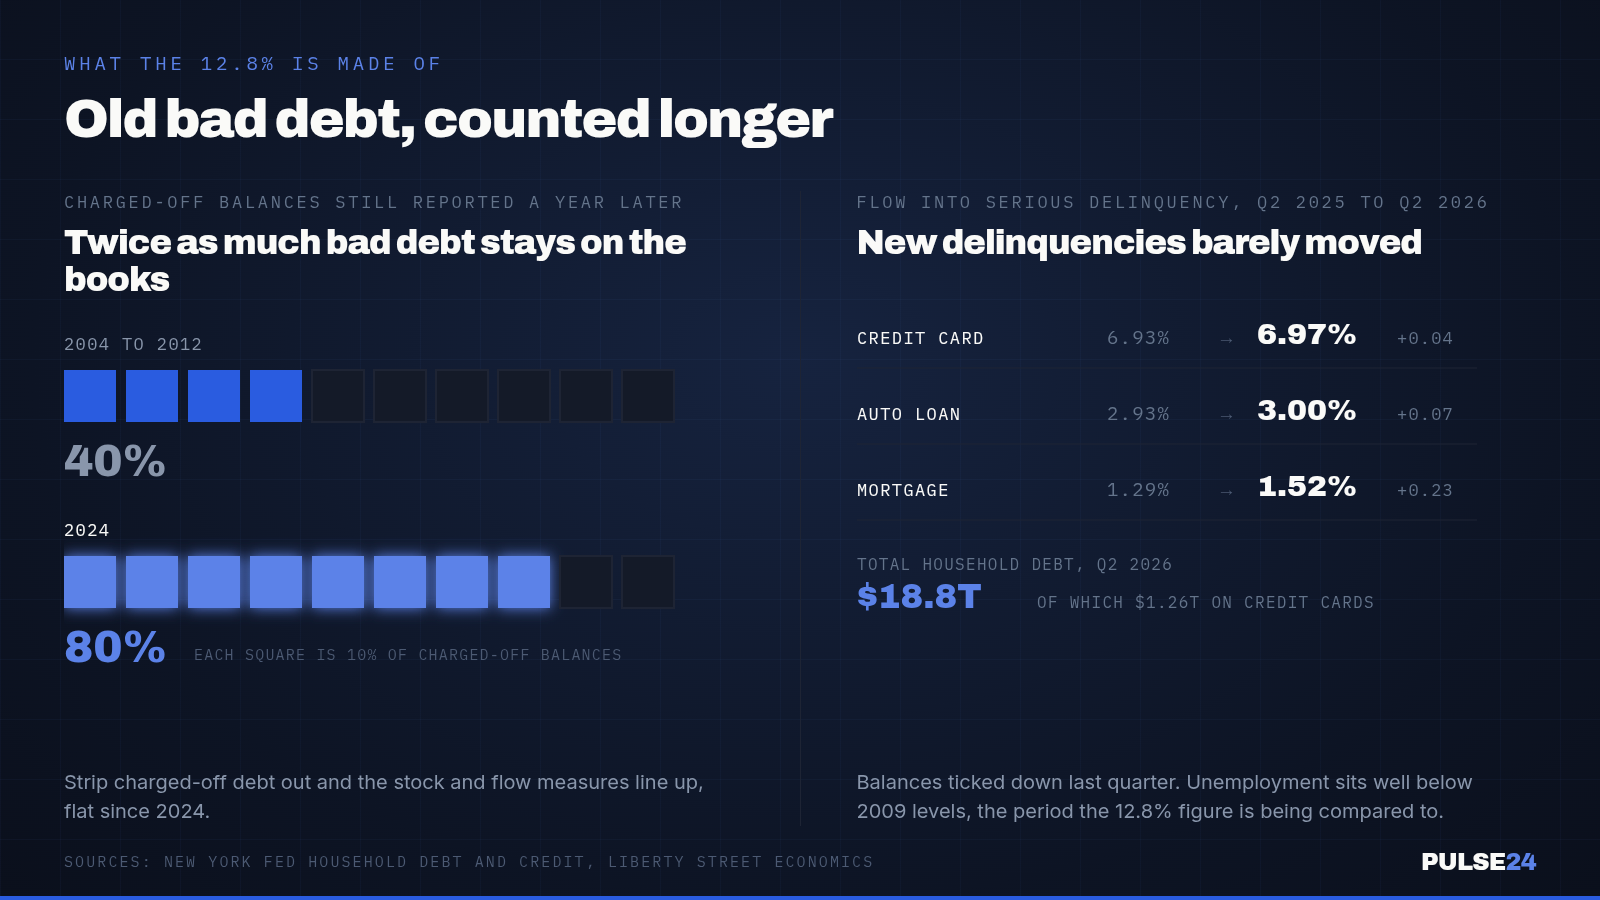
The Fed's broader Q2 2026 report, published the same week, tells a similar story: credit card balances newly transitioning into serious delinquency came in at 6.97% in the second quarter, barely different from 6.93% a year earlier. Auto loan flow delinquencies moved from 2.93% to 3.00% over the same stretch, and mortgages ticked up from 1.29% to 1.52%, still low by historical standards. None of these numbers look like a consumer suddenly falling off a cliff. Joelle Scally, an economic advisor at the New York Fed, put it plainly: delinquency rates across most loan types have held steady for two years.
Why the Headline Number Keeps Climbing Anyway
If new delinquencies aren't accelerating, why does the stock measure keep climbing? Liberty Street's researchers point to a change in how long lenders keep bad debt on their books before writing it off entirely. In 2024, 80% of charged-off credit card balances were still being reported as delinquent a full year later. Between 2004 and 2012, that figure was closer to 40%. Lenders appear to be holding distressed accounts on their books longer than they used to, whether for collections purposes, accounting choices, or loan sale timing. Once researchers strip out charged-off debt entirely, the stock, flow, and other delinquency measures line up and have been essentially flat since 2024. The rising headline number is less a story about consumers borrowing themselves into a hole and more a story about how debt that's already gone bad gets counted.
The K-Shaped Debate Nobody Has Settled
None of this means the consumer picture is uniformly healthy, and total credit card debt did rise to $1.26 trillion in the second quarter, up $21 billion from the prior quarter. Whether that debt is concentrated among stressed lower-income households or spread more evenly depends on which research desk you ask. Moody's Analytics found that spending among the top 10% of earners grew 62% between the third quarter of 2020 and the third quarter of 2025, and that group now accounts for more than 45% of total consumer spending. That's the strongest version of the K-shaped story, where high earners keep spending and everyone else falls behind.
New York Fed consumer spending data tells a milder version of the same trend, with growth ranging from 29% for lower-income households to 36% for higher-income ones since 2020, a real gap but nowhere close to Moody's numbers. Government Consumer Expenditure Survey data, which runs through 2024, shows something closer to the opposite: the lowest-income households increased spending by nearly 4%, the fastest of any group, while the top 10% actually spent less in 2024 than in 2023. A Minneapolis Fed review of all three datasets concluded that the K-shaped narrative is more complicated than any single headline captures, and that wealth, not income, may be the more useful lens for who's actually pulling back.
What to Watch Next
The next Household Debt and Credit report lands in November and will show whether the stock delinquency rate keeps climbing even as the flow rate stays flat, which would support the reporting-lag explanation, or whether flow delinquencies start rising too, which would suggest real distress is building. July retail sales data, due Friday, and Thursday's PPI report will add more texture to whether consumer spending is actually slowing or just shifting between income groups. Credit card issuers' own charge-off disclosures in third-quarter earnings, arriving over the next six weeks, are worth watching too. If charge-off timelines stay stretched out the way Liberty Street describes, expect the 90-day delinquency rate to keep looking worse than the underlying trend for a while longer.
The Pulse24 Take
It's tempting to take a scary-sounding statistic and build a recession narrative around it, and 12.8% next to a Great Recession comparison does the framing work all by itself. But the researchers who built the number are the ones telling you to slow down before drawing that conclusion. A reporting quirk in how long lenders carry bad debt on the books isn't the same as an economy where new borrowers are suddenly falling behind at Great Recession rates, and the data so far says they aren't. The K-shaped question is genuinely unresolved, and that's worth sitting with rather than resolving in either direction based on one dataset. Markets watching for a consumer-led slowdown should watch the flow rate and retail sales, not the headline delinquency number alone.
How we read the data
Curious how we get from raw data to a take like this? Our Trader's Toolkit walks through the tools we lean on.
Explore the Toolkit